Fig. 3.
Download original image
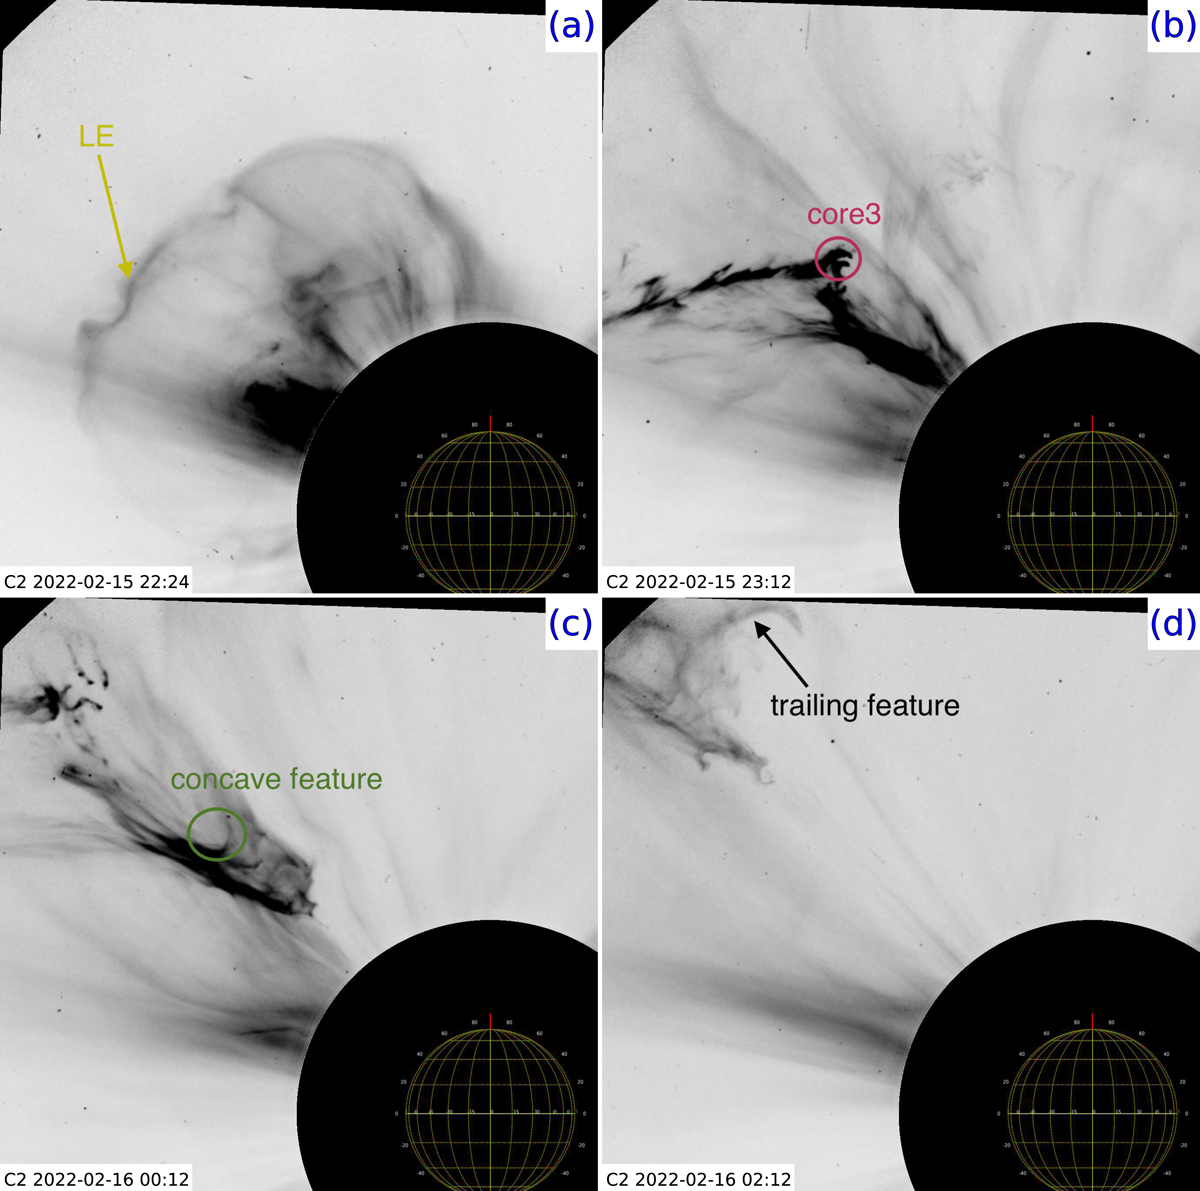
Propagation of the associated CME observed by the SOHO/LASCO C2 coronagraph. An inverted colour table is used (bright coronal features appear darker). A few features used for tracking the CME kinematics are marked (cf. Fig. 2): the LE of the CME at PA 56° (a), the part of the core marked as core3 (b), a concave feature (c), and a trailing feature (d). The image was produced using JHelioviewer (Müller et al. 2017).
Current usage metrics show cumulative count of Article Views (full-text article views including HTML views, PDF and ePub downloads, according to the available data) and Abstracts Views on Vision4Press platform.
Data correspond to usage on the plateform after 2015. The current usage metrics is available 48-96 hours after online publication and is updated daily on week days.
Initial download of the metrics may take a while.