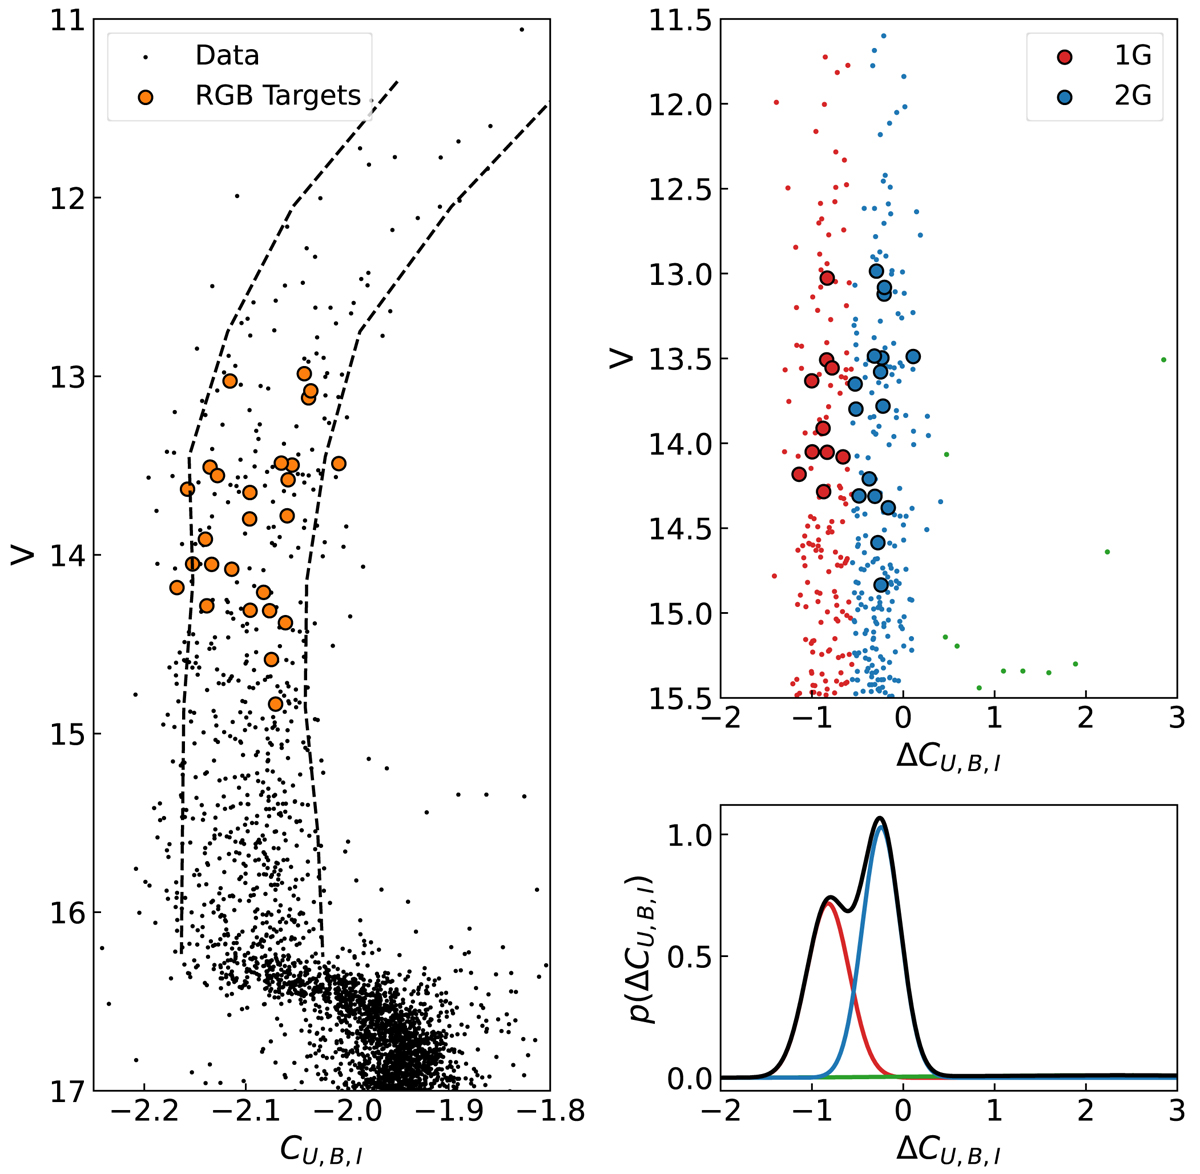
Fig. B.1.
Download original image
Summary of the method used to separate the two stellar populations along the RGB of M4. Left panel: The photometric data in the CU, B, I vs. V plane. Our targets are highlighted as orange points. The two dashed lines mark the location of the 10th and 90th percentiles of the RGB stars for the left and the right line, respectively. Upper right panel: The verticalised RGB (ΔCU, B, I vs. V) of M4. The points are divided between 1G (red) and 2G (blue) according to the GMM reported in the bottom right panel. The green points, seen far from the main RGB, represent the binary population. Bottom right panel: The GMM model used to identify the two stellar populations. The two most prominent Gaussian curves are the ones for the 1G and 2G stars.
Current usage metrics show cumulative count of Article Views (full-text article views including HTML views, PDF and ePub downloads, according to the available data) and Abstracts Views on Vision4Press platform.
Data correspond to usage on the plateform after 2015. The current usage metrics is available 48-96 hours after online publication and is updated daily on week days.
Initial download of the metrics may take a while.