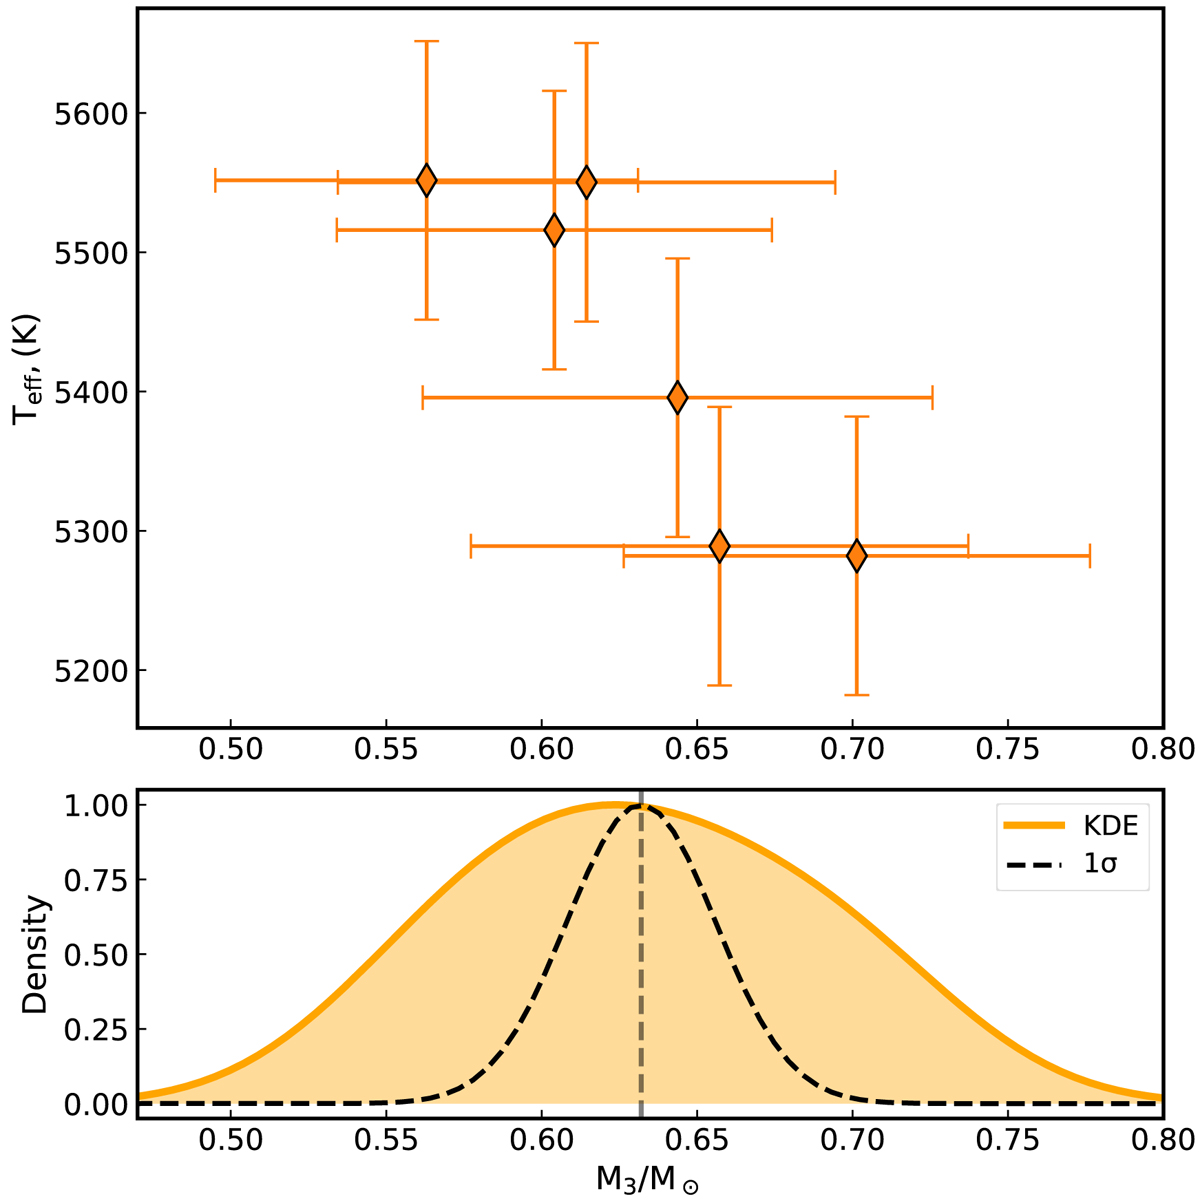
Fig. 3.
Download original image
Properties of the HB stars in our sample. Top: temperature of our rHB targets as a function of their mass. Bottom: Gaussian kernel distribution for the data (orange). The black dashed line represents a single-mass population centred at the value of ⟨MHB⟩ with its corresponding sigma.
Current usage metrics show cumulative count of Article Views (full-text article views including HTML views, PDF and ePub downloads, according to the available data) and Abstracts Views on Vision4Press platform.
Data correspond to usage on the plateform after 2015. The current usage metrics is available 48-96 hours after online publication and is updated daily on week days.
Initial download of the metrics may take a while.