Fig. F.1.
Download original image
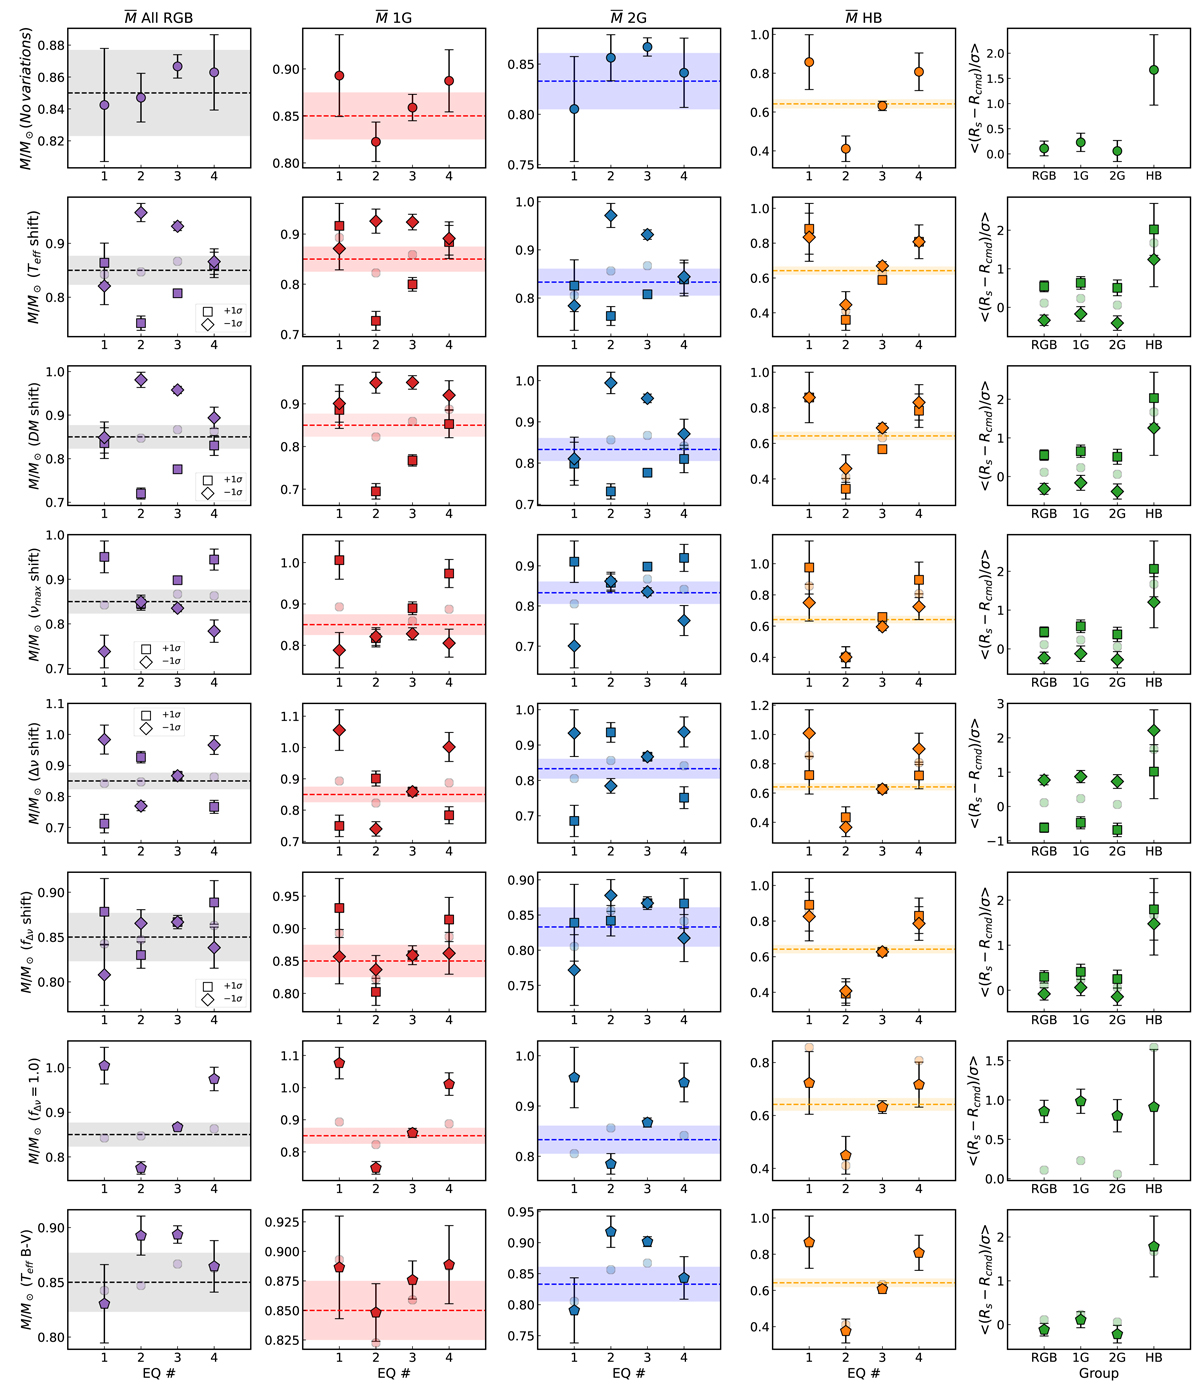
Systematic shift of the average mass and radii dispersion for different groups of stars. The first row reports the non-shifted values, which are also reported as transparent points in each panel. Each row past the first one explores the effects of a shift in a given parameter of its 1σ interval, as labelled. The last two rows report the non-corrected mass and dispersion average values, and what happens when the Temperatures coming from the B − V bands are used. The dashed lines represent the mass derived from the EB results in Kaluzny et al. (2013, 0.85M⊙, first column); the mass of the 1G, the 2G, and the HB from; Tailo et al. (2019, the values are 0.85M⊙, 0.833M⊙, and 0.64M⊙ for the second to fourth columns, respectively); and the shaded areas mark their 1σ intervals.
Current usage metrics show cumulative count of Article Views (full-text article views including HTML views, PDF and ePub downloads, according to the available data) and Abstracts Views on Vision4Press platform.
Data correspond to usage on the plateform after 2015. The current usage metrics is available 48-96 hours after online publication and is updated daily on week days.
Initial download of the metrics may take a while.