Fig. 1.
Download original image
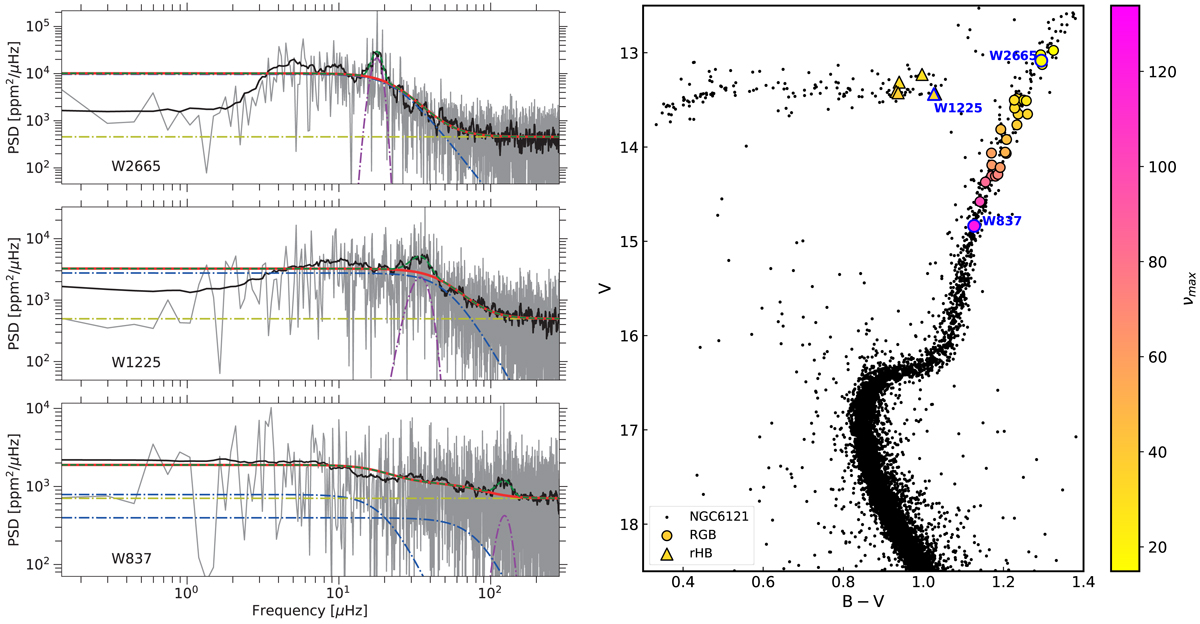
Summary of the targets and spectra analysed in this work. Left: background fits (red curve) overlaid on the stellar PSD (grey) for the stars W837 (lower RGB), W1225 (HB), and W2665 (upper RGB). A smoothing of the PSD using a boxcar with width set to Δν is shown for reference as the black curve. The dot-dashed blue curves depict the Harvey-like components, while the horizontal dot-dashed yellow line and the dot-dashed magenta curve represent the level of the white noise and the Gaussian envelope of the oscillations, respectively. The dashed green line on top of the background fit shows the resulting fit when incorporating the oscillation envelope. We note here that the number of components in the model used for the background fit has been identified as part of the procedure (see Sect. 2 and Appendix A). Right: optical CMD of M4 from Stetson et al. (2019) data in the B and V bands. We show the position of the targets with good photometry and confirmed oscillation excess. The three stars in the left panels are identified as labelled.
Current usage metrics show cumulative count of Article Views (full-text article views including HTML views, PDF and ePub downloads, according to the available data) and Abstracts Views on Vision4Press platform.
Data correspond to usage on the plateform after 2015. The current usage metrics is available 48-96 hours after online publication and is updated daily on week days.
Initial download of the metrics may take a while.