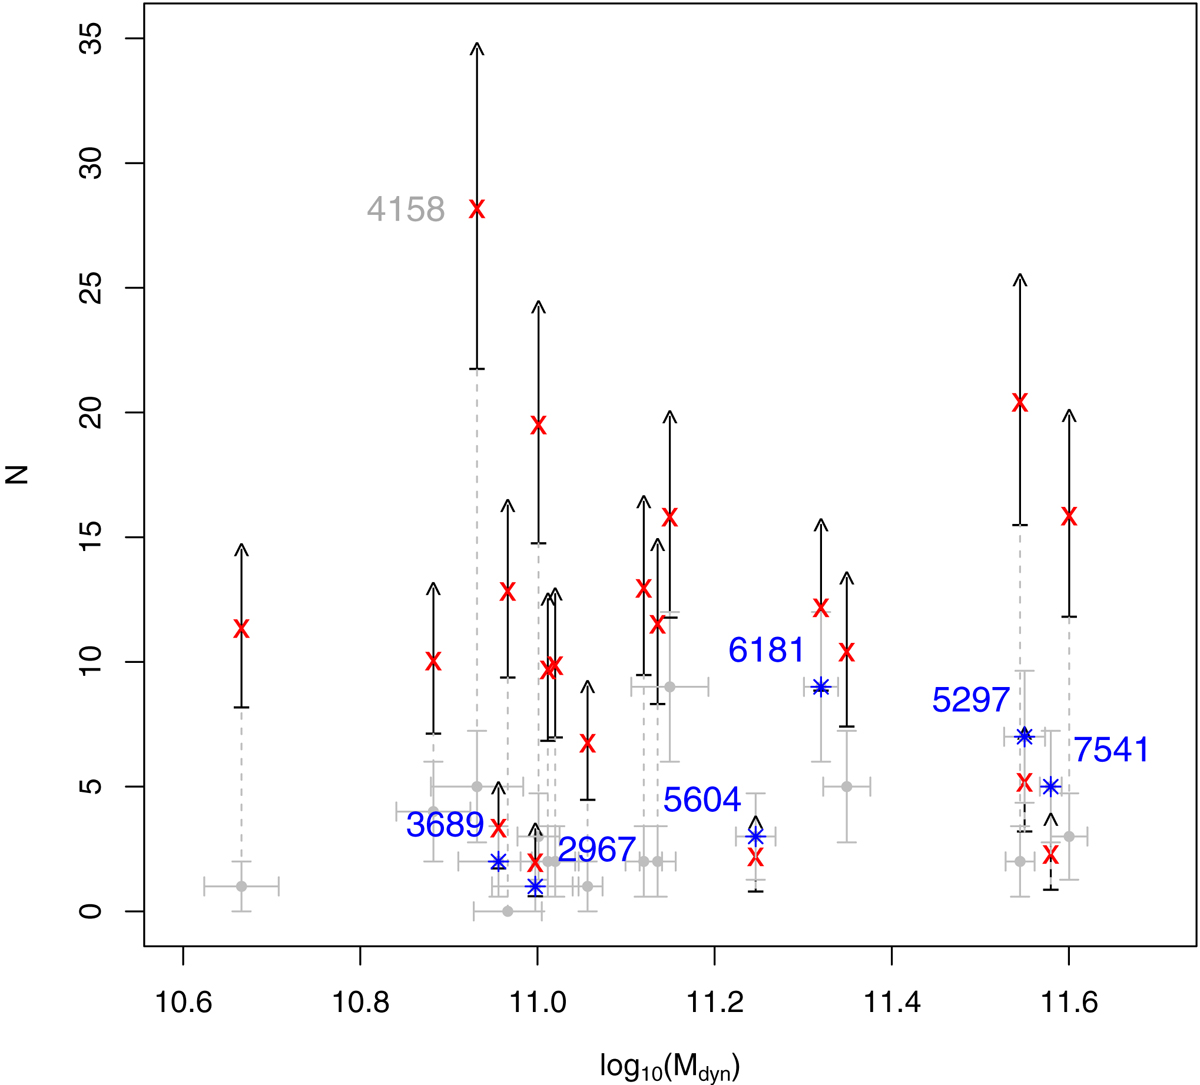
Fig. 6.
Download original image
Relation between dynamical mass and the number of satellites for SAGA galaxies, for which HI line measurements exist in the EDD database: gray circles with error bars denote the number of satellites detected up to the limit of Mr, 0 < −12.3; red crosses give the expected number of satellites if the relation from Javanmardi et al. (2019) holds. Error bars on the y-axis are simply the square root of the number of satellites. Dynamical mass is calculated from Eq. (4), with error bars corresponding to the errors on the rotation velocity only, meaning they are underestimated.
Current usage metrics show cumulative count of Article Views (full-text article views including HTML views, PDF and ePub downloads, according to the available data) and Abstracts Views on Vision4Press platform.
Data correspond to usage on the plateform after 2015. The current usage metrics is available 48-96 hours after online publication and is updated daily on week days.
Initial download of the metrics may take a while.