Fig. 1
Download original image
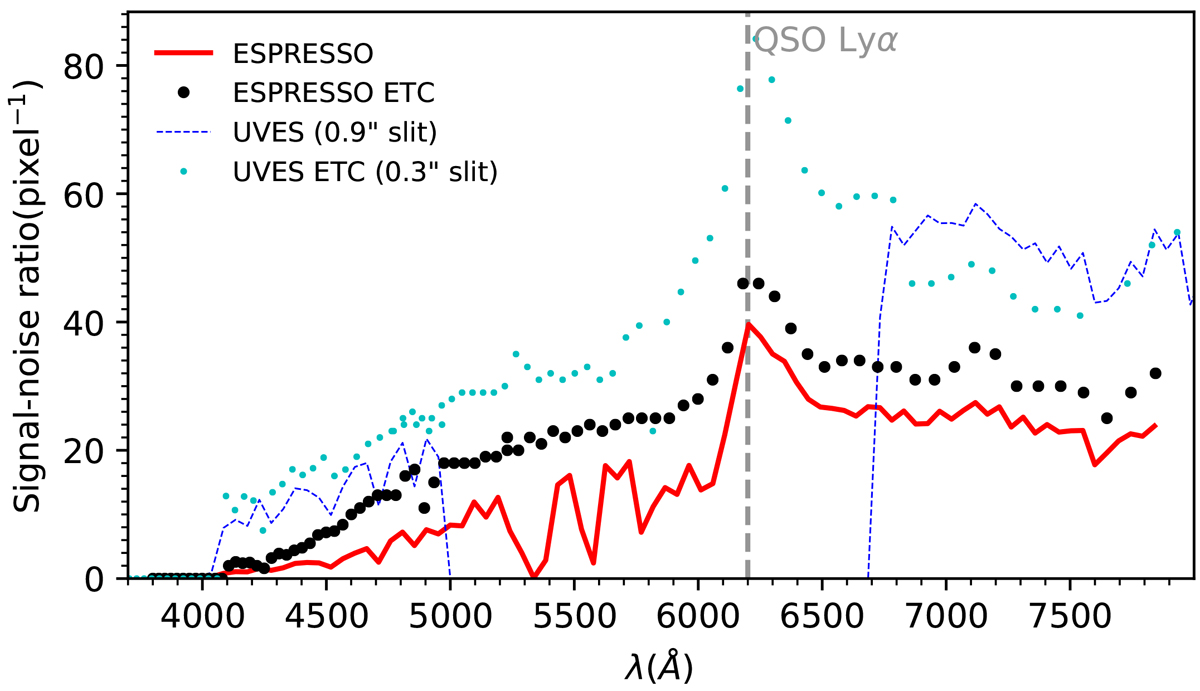
S/N (per pixel; ≈1 km s−1 per pixel) of the observed ESPRESSO spectrum (solid red line) and ETC-estimated values based on a QSO emission template (black circles). The observed spectrum S/N is estimated as the measured flux divided by the standard deviation from the error spectrum. We note that the red line is smoothed by taking the median S/N within a wavelength bin of the same size as the average space between ETC points. For reference, the vertical grey line denotes the Lyα emission line of the observed QSO. The S/N from the ETC consistently ≲20% larger than measured in the observations. For reference, the smoothed S/N from the comparison UVES data (≈2.5 km s−1 per pixel) is shown as the blue dotted line. Due to the gaps in the UVES data wavelength coverage, the observed UVES data do not cover the Lyα emission of the QSO. Additionally, the small cyan dots represent the combined ETC estimate for UVES data taken with two UVES settings, with each setting using a 0.3″ slit (near equivalent R) with the same exposure time per setting (i.e. doubled observing time) and observing conditions as the ESPRESSO data.
Current usage metrics show cumulative count of Article Views (full-text article views including HTML views, PDF and ePub downloads, according to the available data) and Abstracts Views on Vision4Press platform.
Data correspond to usage on the plateform after 2015. The current usage metrics is available 48-96 hours after online publication and is updated daily on week days.
Initial download of the metrics may take a while.