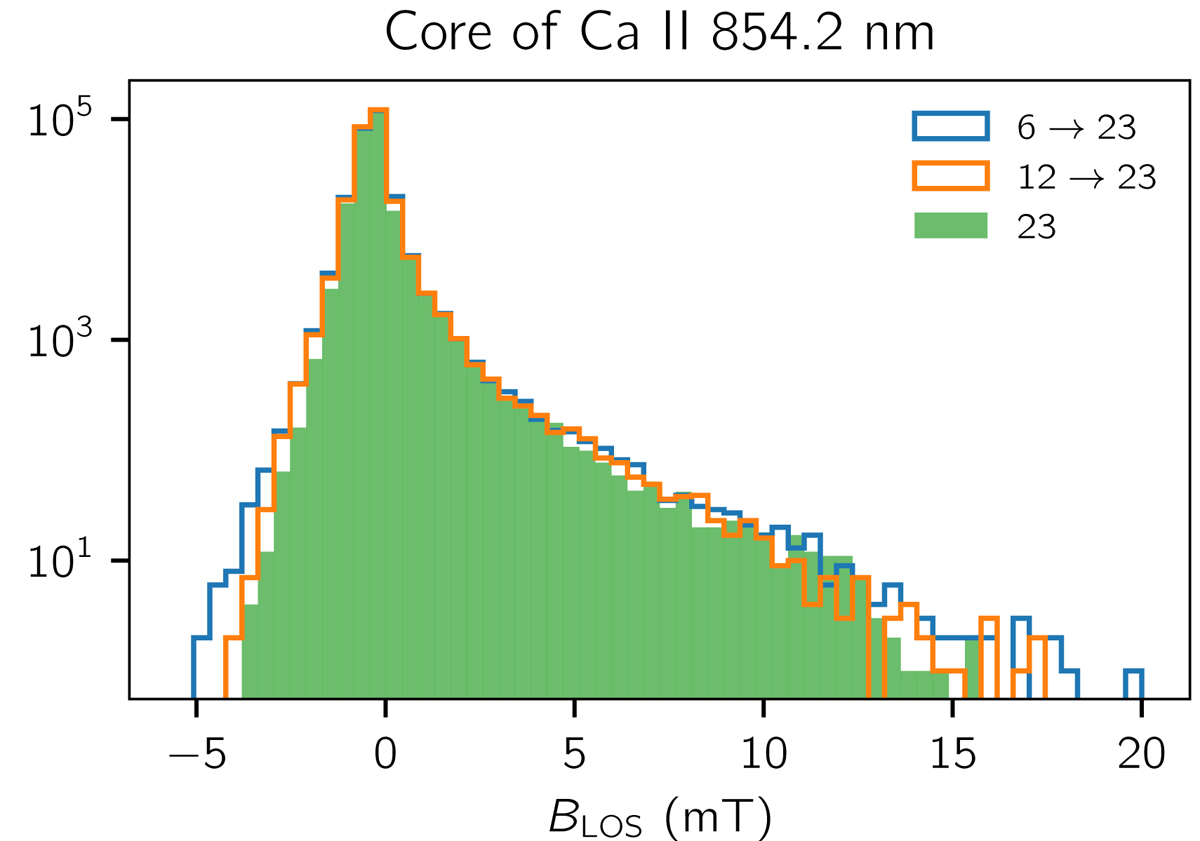
Fig. 7.
Download original image
Histograms of the inferred line-of-sight magnetic field strengths for the Ca II core after degradation to the common 23 km resolution, using the WFA method as given by Eq. (3). We note that here, as in Fig. 5, we include the whole horizontal extent of the simulation in the histograms, and not only the quadrant shown in the colormaps elsewhere.
Current usage metrics show cumulative count of Article Views (full-text article views including HTML views, PDF and ePub downloads, according to the available data) and Abstracts Views on Vision4Press platform.
Data correspond to usage on the plateform after 2015. The current usage metrics is available 48-96 hours after online publication and is updated daily on week days.
Initial download of the metrics may take a while.