Open Access
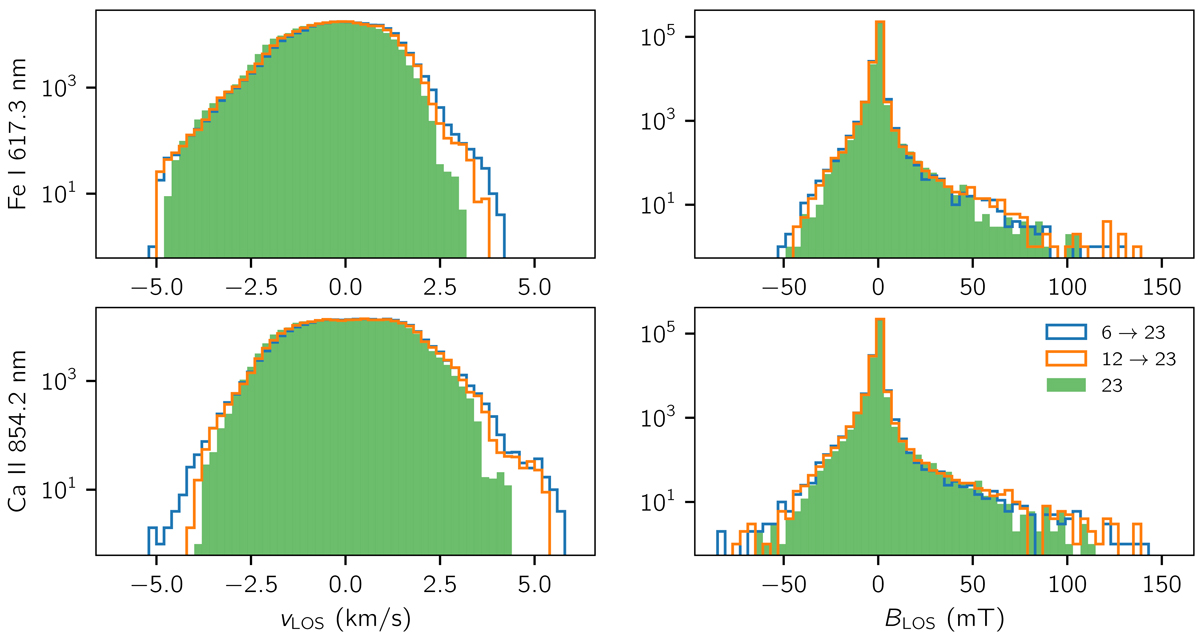
Fig. 5.
Download original image
Histograms of the inferred quantities using the COG method on the whole line profile for Fe I 617.33 nm (top) and Ca II 854.209 nm (bottom). We note that here, as in Fig. 7, we include the whole field of view for the simulation in the histograms, not only the quadrant shown in the colormaps elsewhere.
Current usage metrics show cumulative count of Article Views (full-text article views including HTML views, PDF and ePub downloads, according to the available data) and Abstracts Views on Vision4Press platform.
Data correspond to usage on the plateform after 2015. The current usage metrics is available 48-96 hours after online publication and is updated daily on week days.
Initial download of the metrics may take a while.