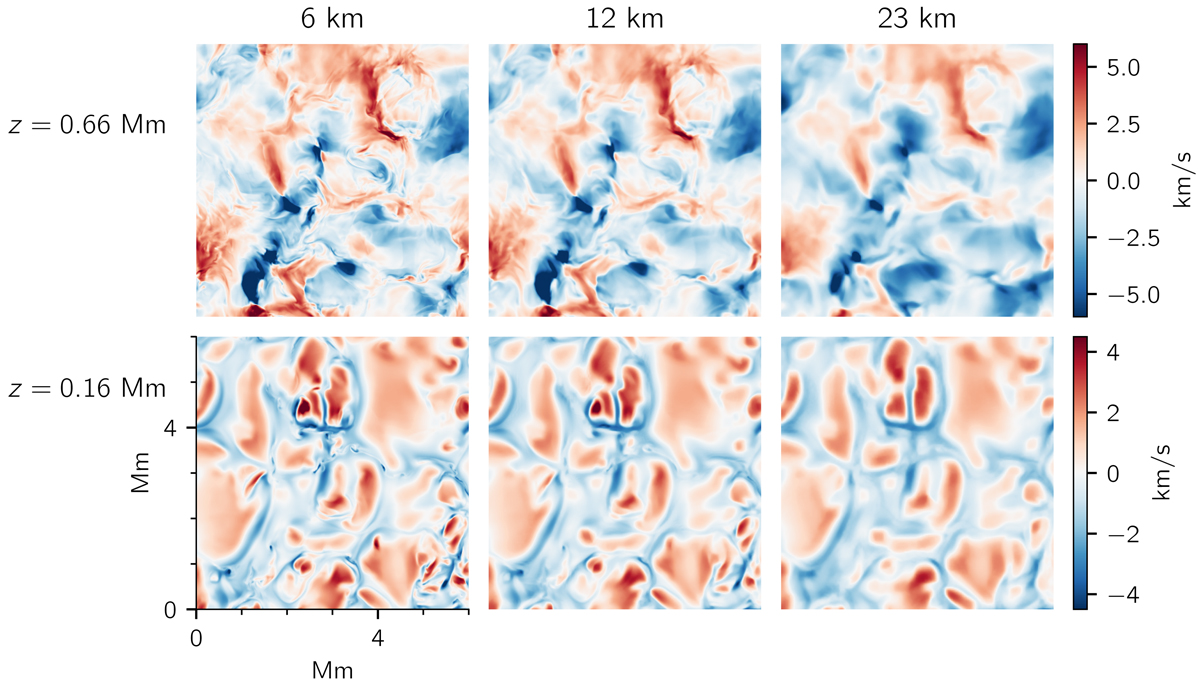
Fig. 1.
Download original image
Line-of-sight velocities taken directly from horizontal slices of the simulations at different heights. The left column shows the 6 km simulation, the middle column shows the 12 km simulation, and the right column shows the 23 km simulation. The top row corresponds to a height of 0.66 Mm, i.e., in the low chromosphere, while the bottom row corresponds to a height of 0.16 Mm, i.e., in the photosphere. It is important to note that here, and in all subsequent colormaps, we only show a quarter of the full simulation extent in order to more easily see fine details.
Current usage metrics show cumulative count of Article Views (full-text article views including HTML views, PDF and ePub downloads, according to the available data) and Abstracts Views on Vision4Press platform.
Data correspond to usage on the plateform after 2015. The current usage metrics is available 48-96 hours after online publication and is updated daily on week days.
Initial download of the metrics may take a while.