Fig. 7.
Download original image
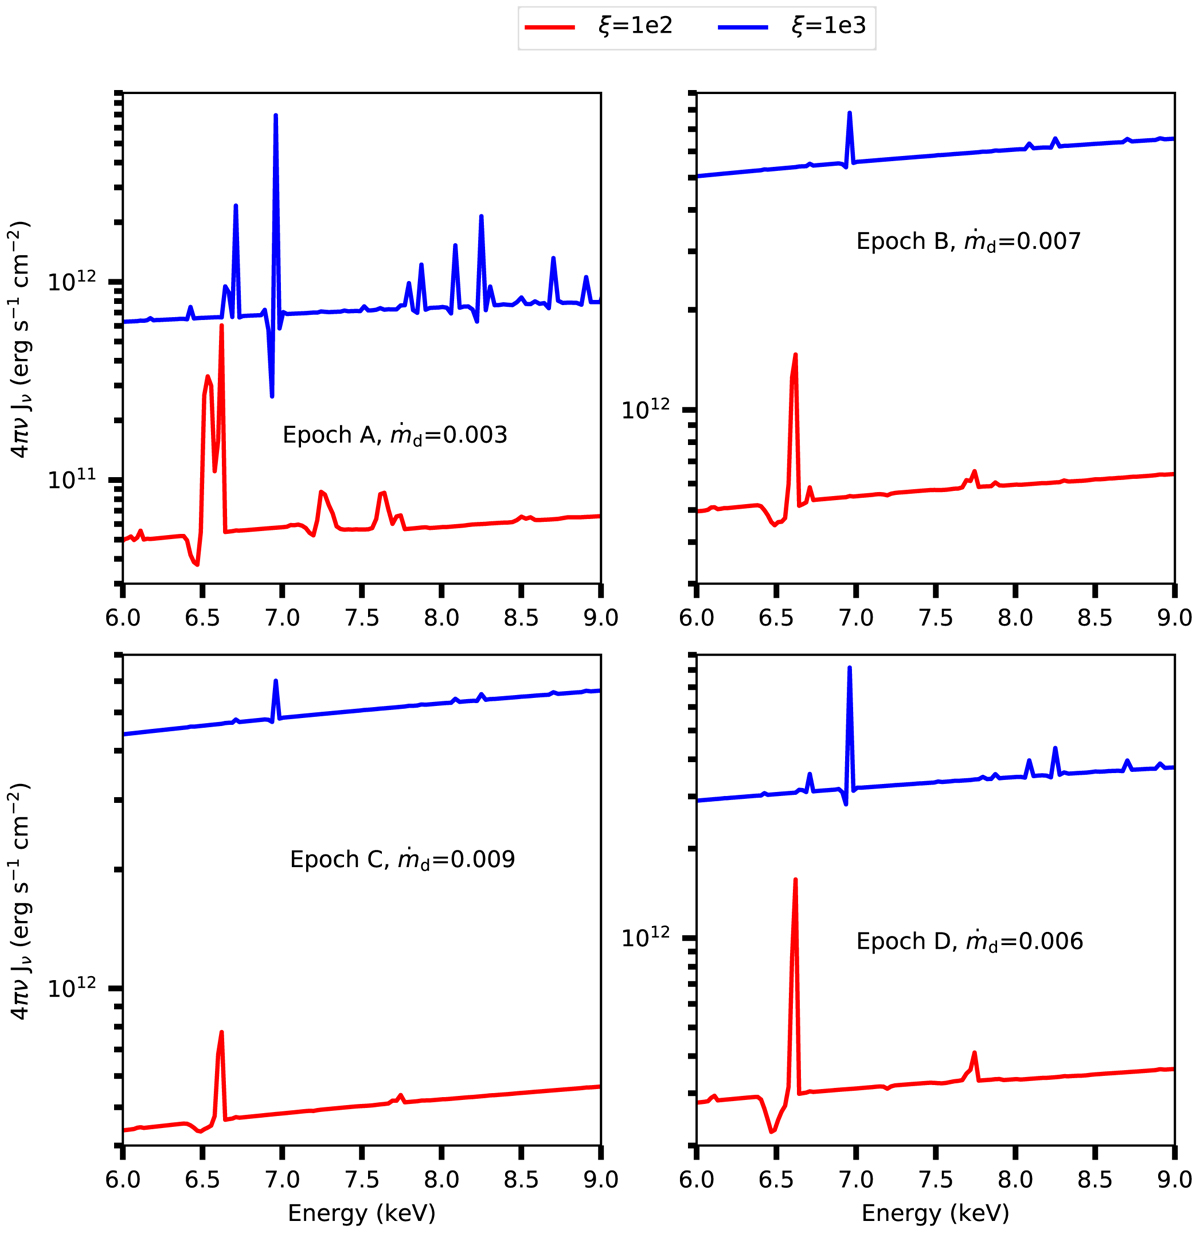
Zoomed-in view of the simulated spectra zoomed between 6 and 9 keV for four different epochs using CLOUDY photoionisation code. The evolution of the absorption properties with the change in the disc mass-accretion rates (as seen from the fitted data) are plotted in each panel. The red and blue lines correspond to ξ = 100 and 1000, respectively. The micro-turbulence of vturb = 1000 km s−1 is used in the simulations for all epochs.
Current usage metrics show cumulative count of Article Views (full-text article views including HTML views, PDF and ePub downloads, according to the available data) and Abstracts Views on Vision4Press platform.
Data correspond to usage on the plateform after 2015. The current usage metrics is available 48-96 hours after online publication and is updated daily on week days.
Initial download of the metrics may take a while.