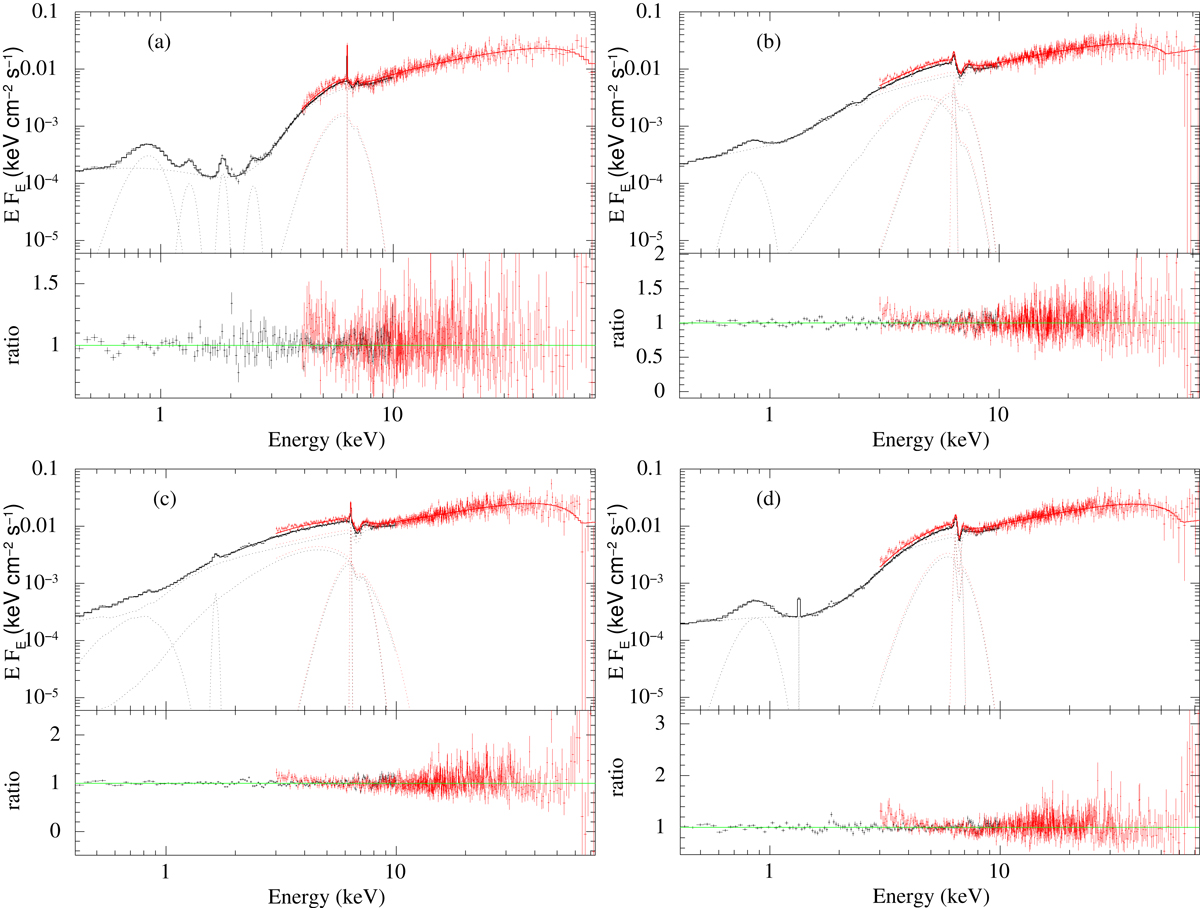
Fig. 2.
Download original image
JeTCAF model-fitted 0.4−75.0 keV spectra for all four epochs of NGC 1365 during XMM-Newton and NuSTAR era. Here, panels a–d corresponds to epochs A to D. The different Gaussian lines are used for emission/excess at different energy ranges, including at ∼6.4 keV. The model fits show the absorption line and spectral shape change in each epoch, along with a P Cygni profile in the FeK band.
Current usage metrics show cumulative count of Article Views (full-text article views including HTML views, PDF and ePub downloads, according to the available data) and Abstracts Views on Vision4Press platform.
Data correspond to usage on the plateform after 2015. The current usage metrics is available 48-96 hours after online publication and is updated daily on week days.
Initial download of the metrics may take a while.