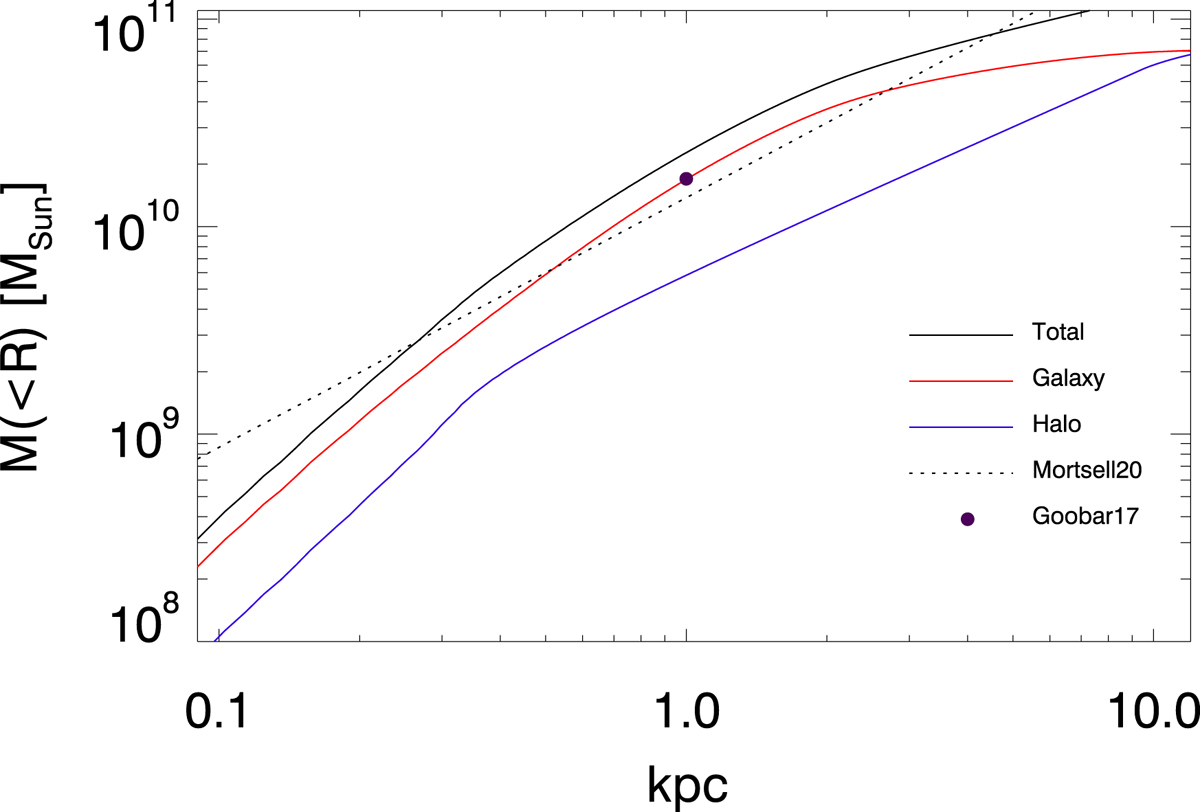
Fig. 9.
Download original image
Circularly averaged integrated mass profiles of the best model for the case where only positional constraints are used. The profile of the galaxy is shown in red and the profile of the halo is shown in blue. The profile of the total mass is shown as a black curve. The black dot at 1 kpc is the estimated mass in the original lens model of Goobar et al. (2017). The dotted line is the new estimate by Mörtsell et al. (2020) using a circular aperture. An isothermal profile scales its integrated mass as the radius.
Current usage metrics show cumulative count of Article Views (full-text article views including HTML views, PDF and ePub downloads, according to the available data) and Abstracts Views on Vision4Press platform.
Data correspond to usage on the plateform after 2015. The current usage metrics is available 48-96 hours after online publication and is updated daily on week days.
Initial download of the metrics may take a while.