Fig. 5.
Download original image
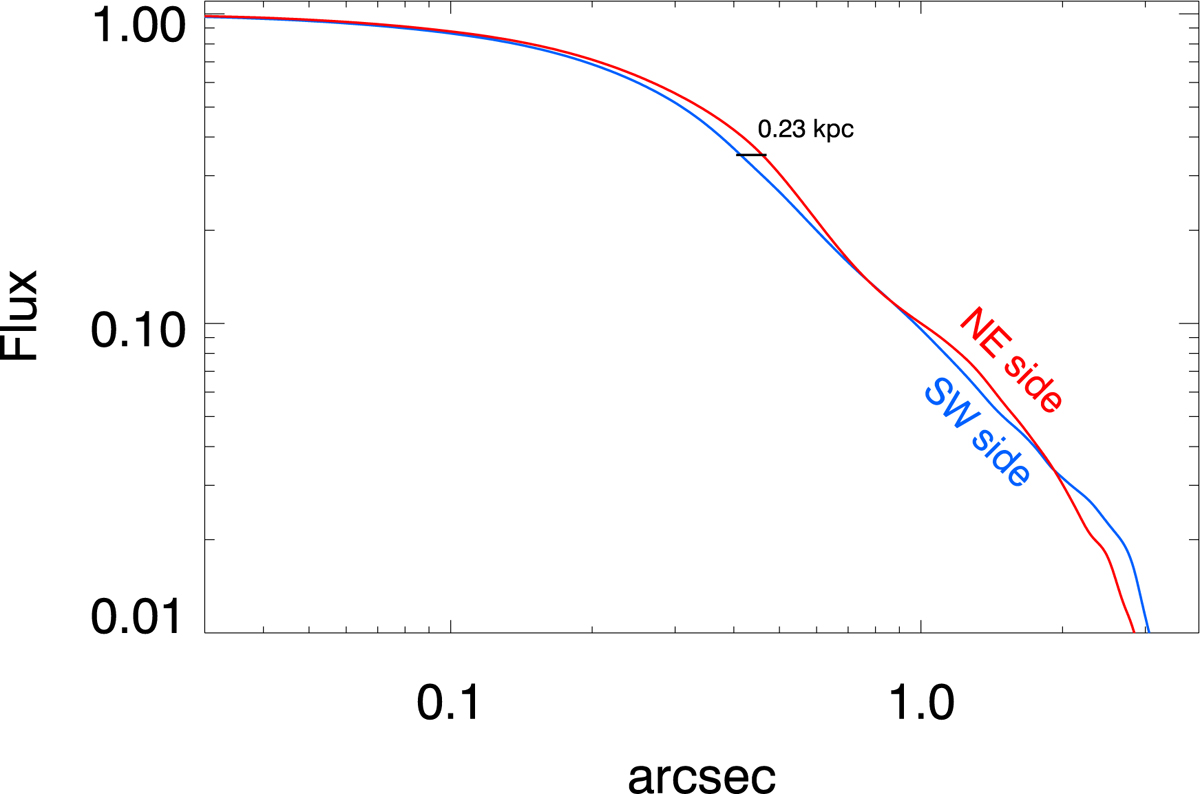
Profile of the galaxy after projecting along the major axis. The center of the profile is taken at the maximum of the observed flux, in the center of the galaxy. The map is divided in two sectors, NE and SW. The profile of the SW sector is marked with a red curve and the profile for the SW sector is shown in blue. We note an excess in the NE sector with respect to the SW sector at ≈0.4″ (or ≈1.6 kpc). The small black solid line is equal to the size of the displacement (0.23 kpc) along the major axis in the NE direction applied to the dark matter halo in Fig. 3.
Current usage metrics show cumulative count of Article Views (full-text article views including HTML views, PDF and ePub downloads, according to the available data) and Abstracts Views on Vision4Press platform.
Data correspond to usage on the plateform after 2015. The current usage metrics is available 48-96 hours after online publication and is updated daily on week days.
Initial download of the metrics may take a while.