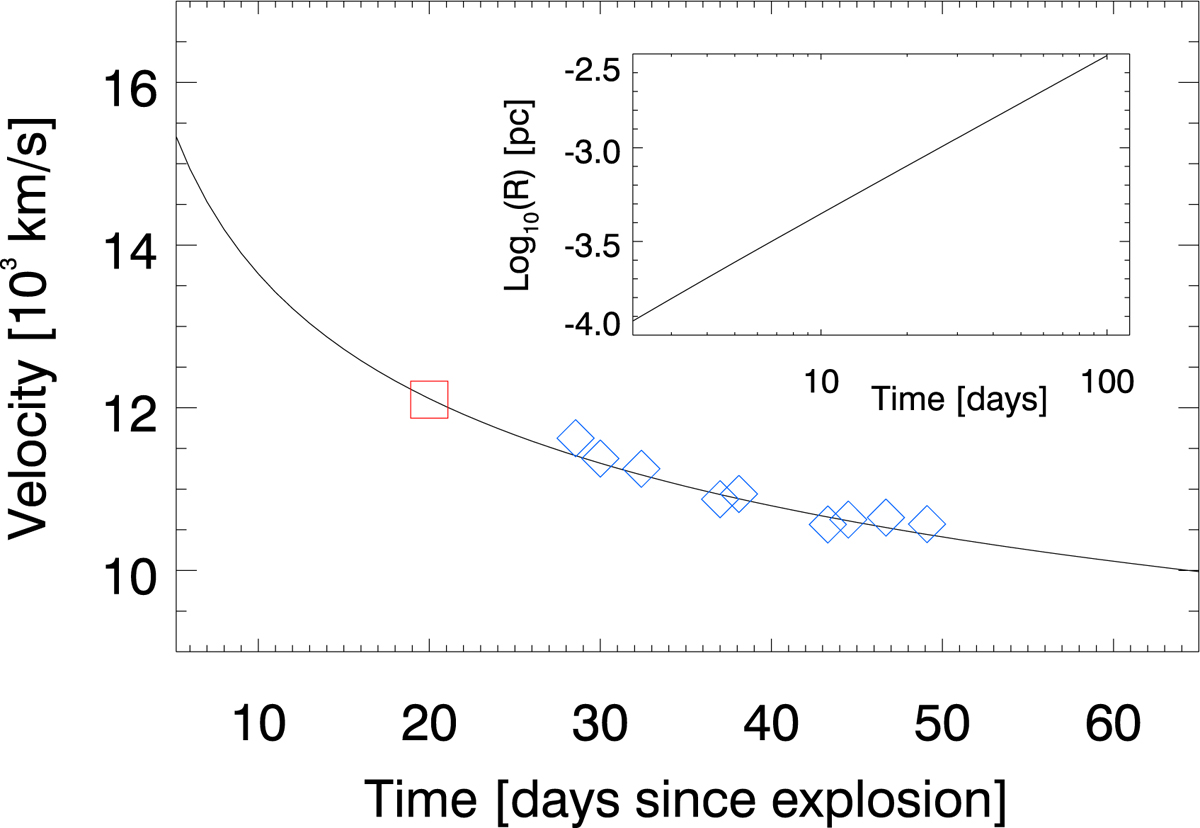
Fig. D.1.
Download original image
Expanding photosphere. The blue diamond symbols are the estimated velocities from Johansson et al. (2021). The red square shows the estimated velocity by the same authors at the time of maximum luminosity. The solid line is a model with the standard exponent of 0.22, vexp ∝ t−0.22 (see text). The small inset plot in the top right shows the radius of the photosphere for this model of the velocity expansion.
Current usage metrics show cumulative count of Article Views (full-text article views including HTML views, PDF and ePub downloads, according to the available data) and Abstracts Views on Vision4Press platform.
Data correspond to usage on the plateform after 2015. The current usage metrics is available 48-96 hours after online publication and is updated daily on week days.
Initial download of the metrics may take a while.