Fig. B.4.
Download original image
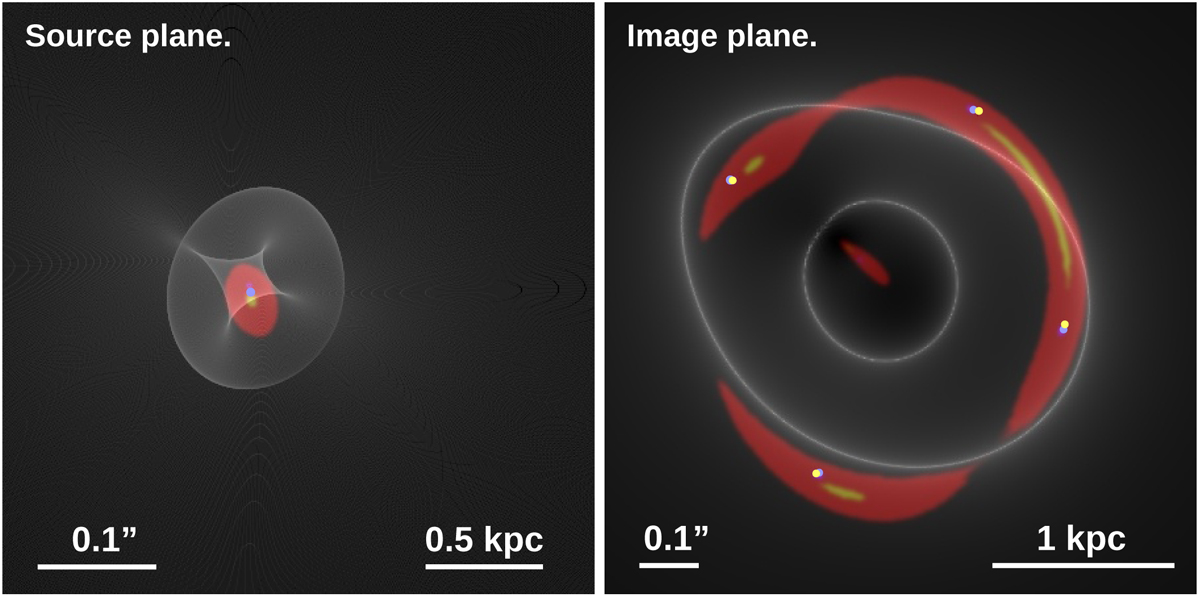
Caustics (left) and critical curves (right) for the best model with α = 1.2, where only the four SN positions are used as constraints. A simple source with just three components, nucleus (orange), halo (red) and SN (blue) is shown in the left panel (source plane). The predicted image is shown in the right panel (image plane). The yellow dots in the right panel mark the observed position of the four SN images. The predicted position for images 2 and 3 overlap with the yellow dots. Note the additional fifth image behind the center of the galaxy.
Current usage metrics show cumulative count of Article Views (full-text article views including HTML views, PDF and ePub downloads, according to the available data) and Abstracts Views on Vision4Press platform.
Data correspond to usage on the plateform after 2015. The current usage metrics is available 48-96 hours after online publication and is updated daily on week days.
Initial download of the metrics may take a while.