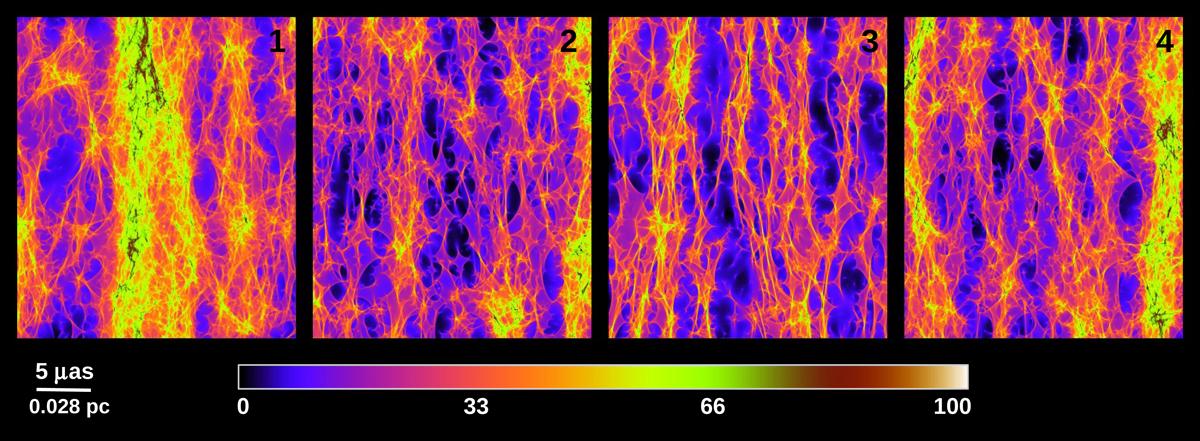
Fig. A.1.
Download original image
Portion of the simulated region for each one of the four SN positions (labeled in the top-right corner of each panel). The magnification maps have been smoothed with a Gaussian of FWHM = 2.8 × 10⁻⁴ pc (or roughly, the extension of a typical SN photosphere around the time of peak emission). The area and color scale are the same for all panels. The region shown in the left panel is the same as the one in Figure 14.
Current usage metrics show cumulative count of Article Views (full-text article views including HTML views, PDF and ePub downloads, according to the available data) and Abstracts Views on Vision4Press platform.
Data correspond to usage on the plateform after 2015. The current usage metrics is available 48-96 hours after online publication and is updated daily on week days.
Initial download of the metrics may take a while.