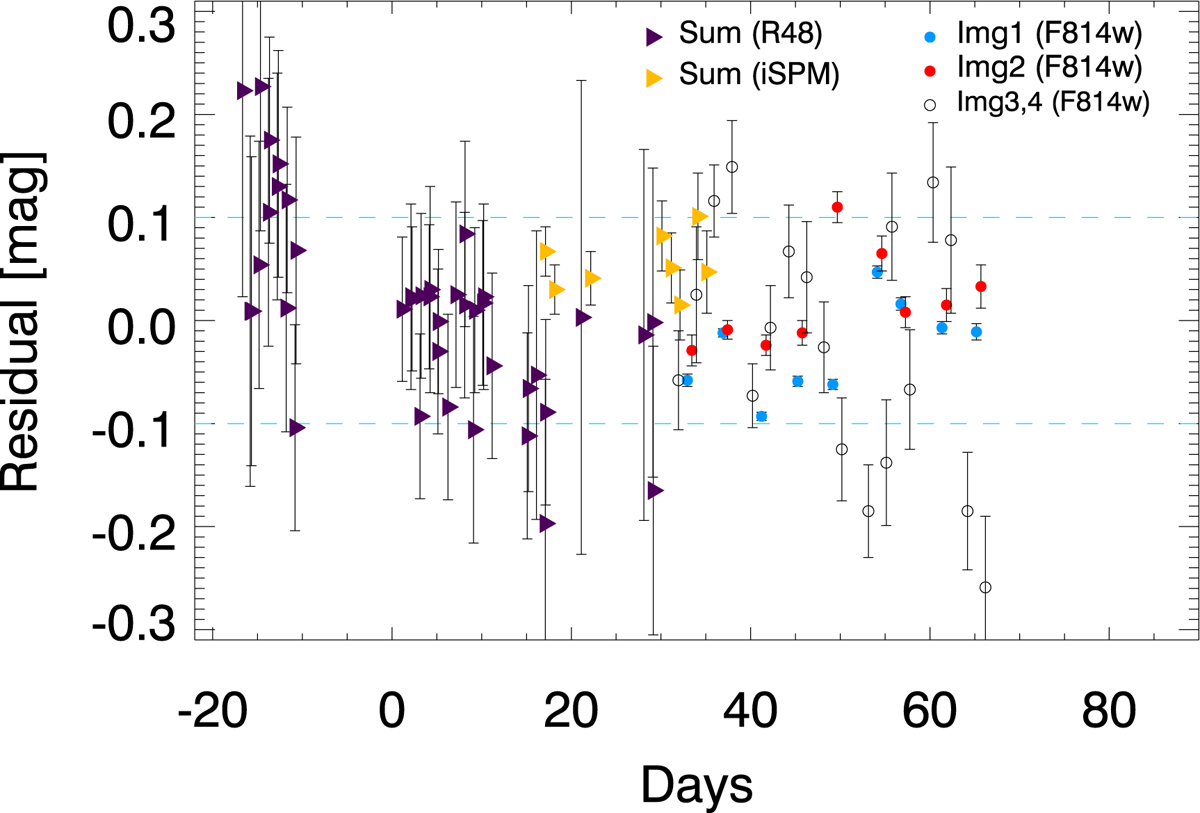
Fig. 2.
Download original image
Residual between the observed flux and the light-curve model in Goobar et al. (2017), Dhawan et al. (2020), Johansson et al. (2021), Mörtsell et al. (2020). The x-axis shows the days since the maximum of the light curve. Only a subset of the entire data set is shown. HST data (F814W and F625W) is available only ≈30 days after the maximum. Prior to this date, the observations cannot resolve the four individual images so the residual corresponds to the sum of all four images. The dashed line marks the adopted ±0.1 mag upper limit, for the allowed range of variability in the light curves.
Current usage metrics show cumulative count of Article Views (full-text article views including HTML views, PDF and ePub downloads, according to the available data) and Abstracts Views on Vision4Press platform.
Data correspond to usage on the plateform after 2015. The current usage metrics is available 48-96 hours after online publication and is updated daily on week days.
Initial download of the metrics may take a while.