Fig. 18.
Download original image
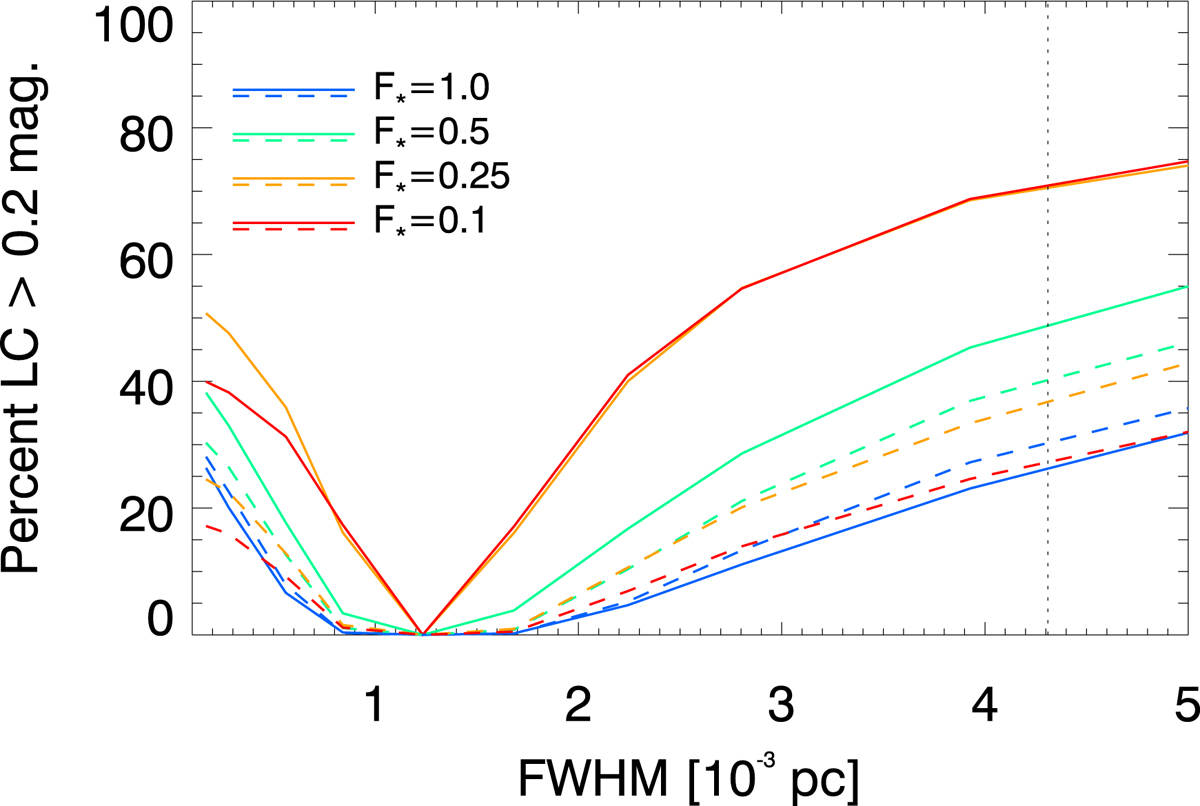
Percentage of light curves with deviations above 0.2 mag as a function of photosphere size. Each color represents a different fraction of the stellar component with F* = 1 corresponding to the fiducial model and F* = 0.1 with a model having ten times less microlens surface mass density. The solid lines are for the image 1 and the dashed lines are for image 2. Note how, especially for image 1, reducing the mass in the microlens model can result in more frequent distortions in the light curve. The vertical dotted line marks the FWHM 65 days after the explosion (FWHM = 2 * R = 4.31 × 10⁻³ pc, in the SN rest frame, see Appendix D).
Current usage metrics show cumulative count of Article Views (full-text article views including HTML views, PDF and ePub downloads, according to the available data) and Abstracts Views on Vision4Press platform.
Data correspond to usage on the plateform after 2015. The current usage metrics is available 48-96 hours after online publication and is updated daily on week days.
Initial download of the metrics may take a while.