Fig. 17.
Download original image
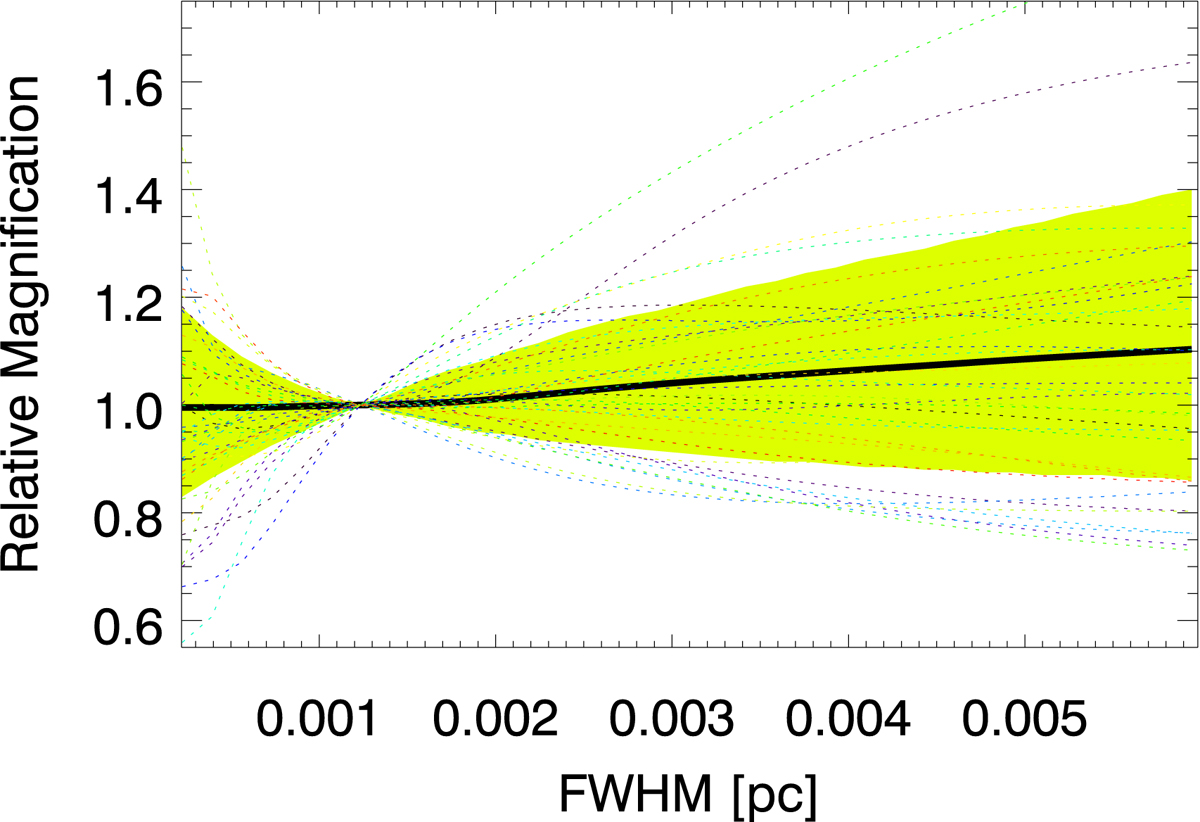
Photosphere weighted magnification distortion acting over the light curves, computed at the position of image 1. The distortion is plotted as a function of the FWHM of the expanding photosphere, and each realization has been re-scaled to the moment where the SN reaches maximum luminosity (FWHM ≈ 1.2 × 10⁻³ pc). The green region marks the 68% confidence interval from over 7 million simulated distortion curves. The colored dotted curves show 35 individual random realizations out of the 7 million. The thick black curve corresponds to the average of the 7 million curves.
Current usage metrics show cumulative count of Article Views (full-text article views including HTML views, PDF and ePub downloads, according to the available data) and Abstracts Views on Vision4Press platform.
Data correspond to usage on the plateform after 2015. The current usage metrics is available 48-96 hours after online publication and is updated daily on week days.
Initial download of the metrics may take a while.