Fig. 16.
Download original image
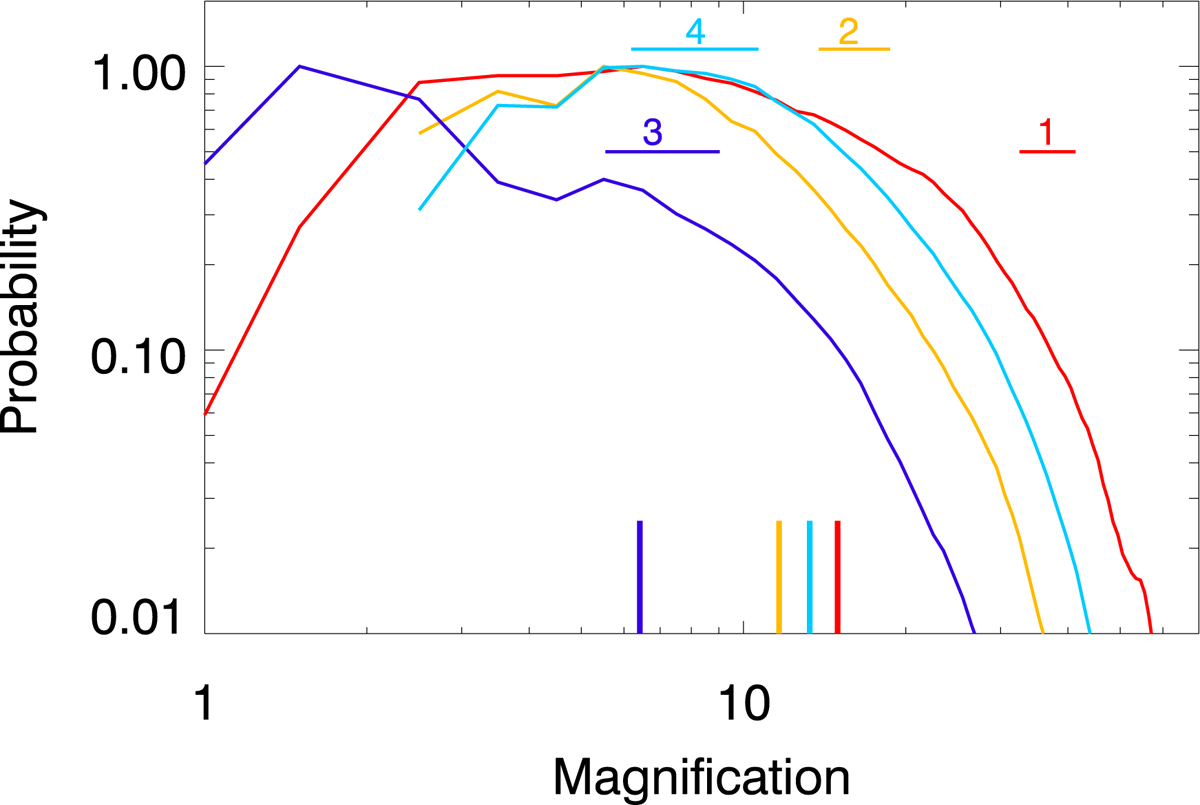
Probability of magnification at the four image positions when microlenses are added. Each color corresponds to one of the positions. The horizontal bars show the observed magnification from Dhawan et al. (2020) (after correcting for extinction) with its uncertainty. The four vertical lines in the bottom of the plot mark the predicted magnification from the macromodel (i.e., without microlenses). The curves show the probability of the magnification when microlenses are included. The curves are computed assuming the source is a Gaussian with FWHM = 5.6 × 10⁻⁴ pc. This size is similar to the extent of the photosphere of a typical SN during its peak emission.
Current usage metrics show cumulative count of Article Views (full-text article views including HTML views, PDF and ePub downloads, according to the available data) and Abstracts Views on Vision4Press platform.
Data correspond to usage on the plateform after 2015. The current usage metrics is available 48-96 hours after online publication and is updated daily on week days.
Initial download of the metrics may take a while.