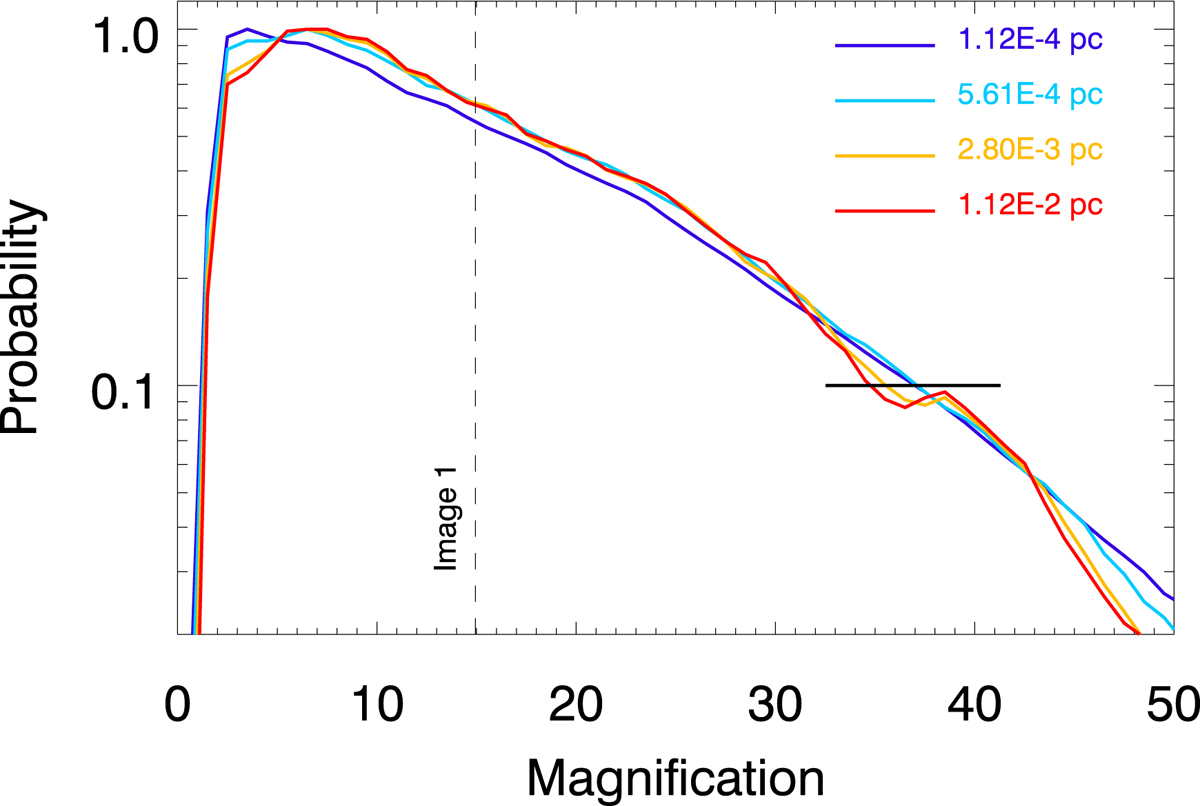
Fig. 15.
Download original image
Probability of magnification (dN/dμ) at the position 1 and with microlensing from stars. The surface mass density of stars is the one corresponding to the baryon model in position 1 listed in Table 1. The IMF is a Salpeter model with a cutoff in 0.1 M⊙ and includes remnants. The dashed vertical line marks the predicted magnification from the macromodel (without microlensing) at position 1. The black horizontal line marks the range for the observed magnification from Dhawan et al. (2020). Each curve represents the magnification experienced by a source modeled as a Gaussian with different FWHM (expressed in pc). For typical expansion velocities of the photosphere, the smallest FWHM represents the size of an expanding photosphere after a few days the initial explosion. After two months, the photosphere is expected to have expanded up to a radius R ≈ 2 × 10⁻³ pc (orange curve).
Current usage metrics show cumulative count of Article Views (full-text article views including HTML views, PDF and ePub downloads, according to the available data) and Abstracts Views on Vision4Press platform.
Data correspond to usage on the plateform after 2015. The current usage metrics is available 48-96 hours after online publication and is updated daily on week days.
Initial download of the metrics may take a while.