Fig. 13.
Download original image
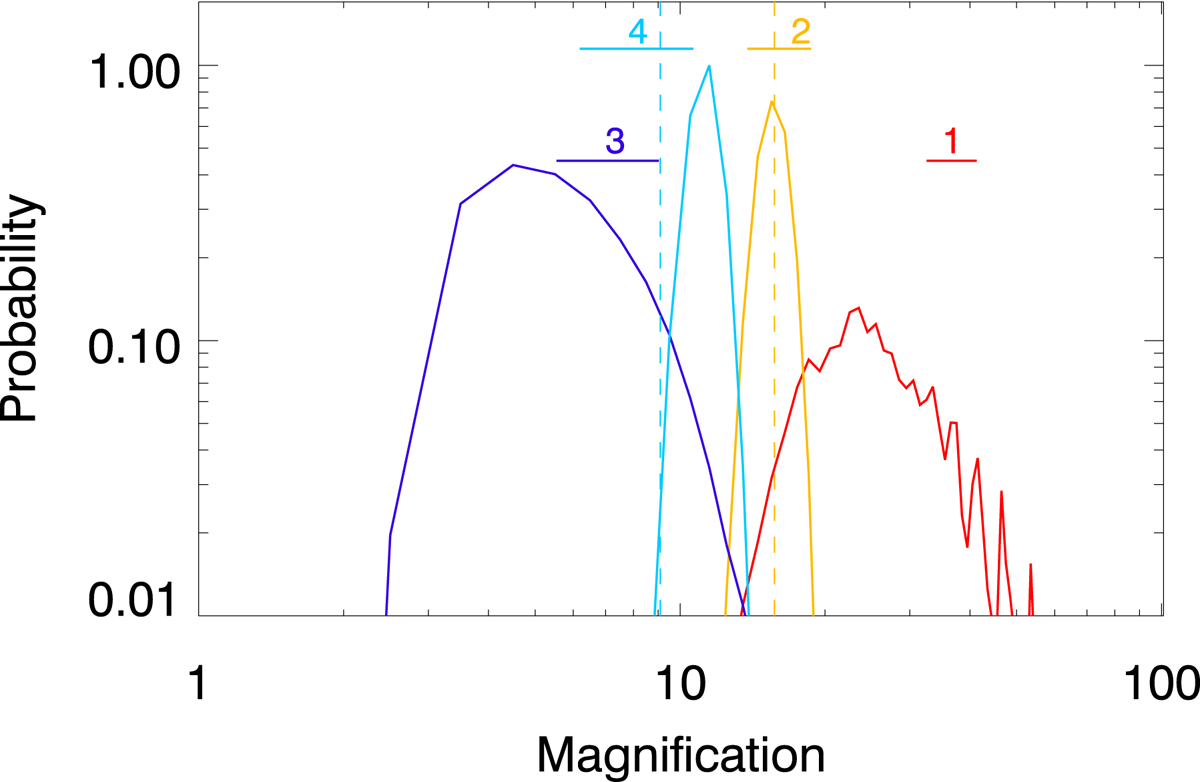
Same Fig. 8 but when both position plus magnification (of images 2 and 4) are used as constraints. The curves show the marginalized probability for the magnification at the position of the four SNe images. The horizontal colored lines show the inferred range of magnification from observations. The two dashed lines indicate the magnification values used to constrain the lens model in images 2 and 4.
Current usage metrics show cumulative count of Article Views (full-text article views including HTML views, PDF and ePub downloads, according to the available data) and Abstracts Views on Vision4Press platform.
Data correspond to usage on the plateform after 2015. The current usage metrics is available 48-96 hours after online publication and is updated daily on week days.
Initial download of the metrics may take a while.