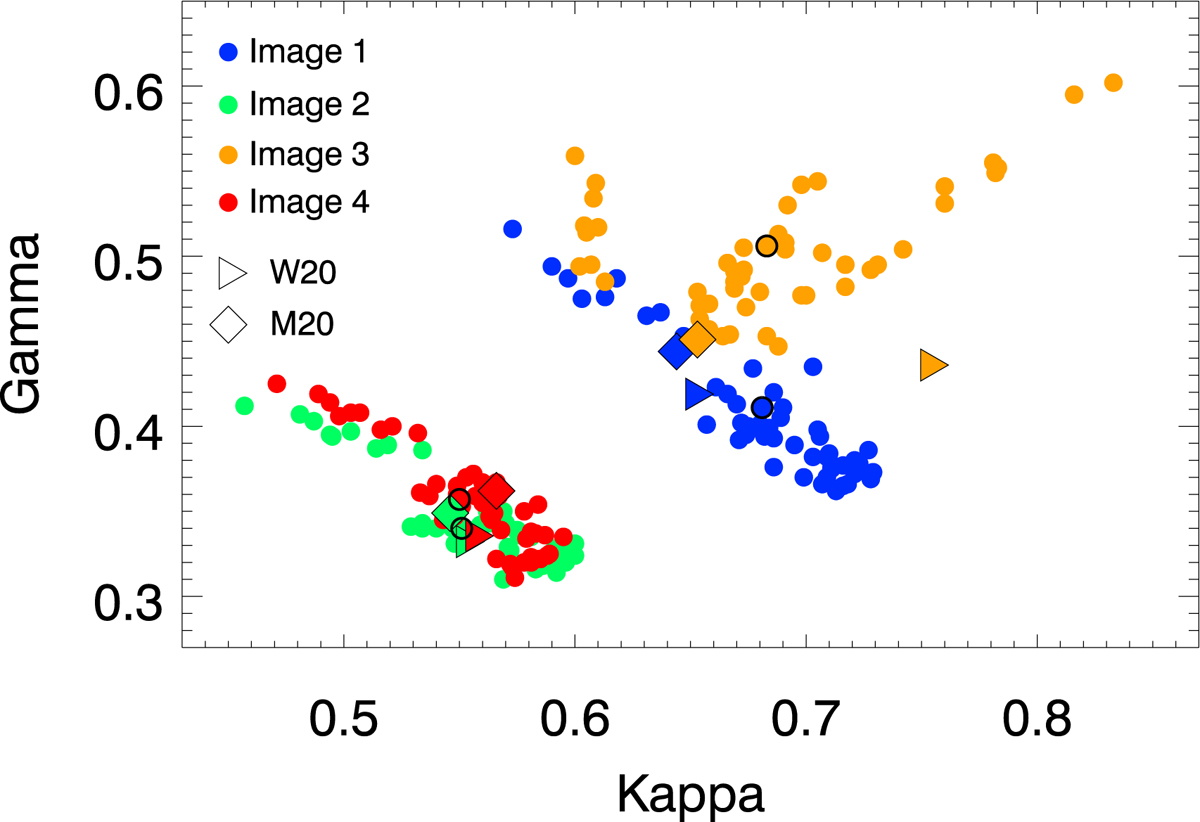
Fig. 10.
Download original image
Range of convergence and shear for the best models. The colored disks show the values of κ and γ for 50 models which are randomly selected among the best likelihoods according to Eq. (4). Different colors are used for each image position. The disks surrounded by the thick black circles correspond to the best model in Table 1. The triangles are the model M3 in Williams & Zegeye (2020), while the diamonds are the model in Mörtsell et al. (2020).
Current usage metrics show cumulative count of Article Views (full-text article views including HTML views, PDF and ePub downloads, according to the available data) and Abstracts Views on Vision4Press platform.
Data correspond to usage on the plateform after 2015. The current usage metrics is available 48-96 hours after online publication and is updated daily on week days.
Initial download of the metrics may take a while.