Fig. 6
Download original image
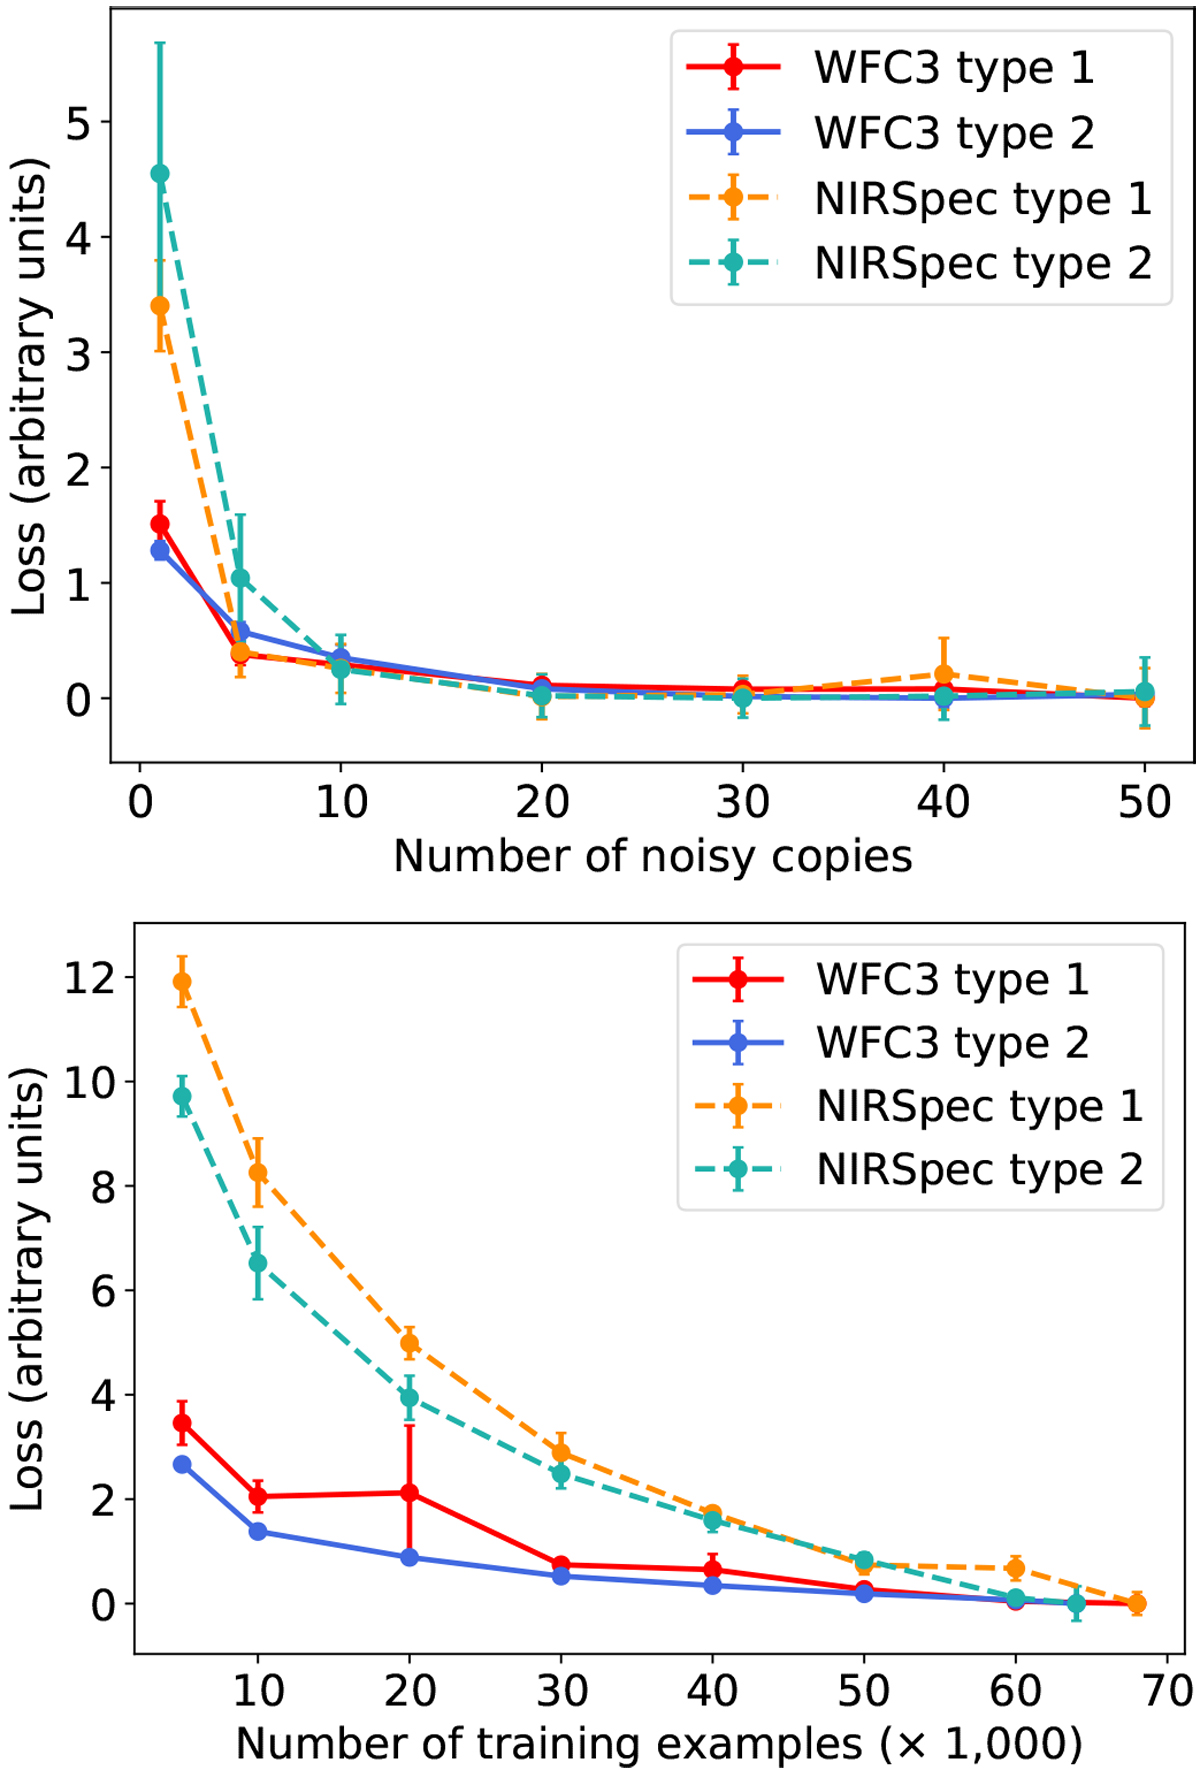
Improvement in the performance of the CNNs for varying sizes of training sets. Top: Loss reached by the CNN for all combinations of instrument and model complexity versus the number of noisy copies. Bottom: Loss reached by the CNN for all combinations of instrument and model complexity versus the number of forward models in the training set. The curves have been shifted vertically so they reach a value of zero.
Current usage metrics show cumulative count of Article Views (full-text article views including HTML views, PDF and ePub downloads, according to the available data) and Abstracts Views on Vision4Press platform.
Data correspond to usage on the plateform after 2015. The current usage metrics is available 48-96 hours after online publication and is updated daily on week days.
Initial download of the metrics may take a while.