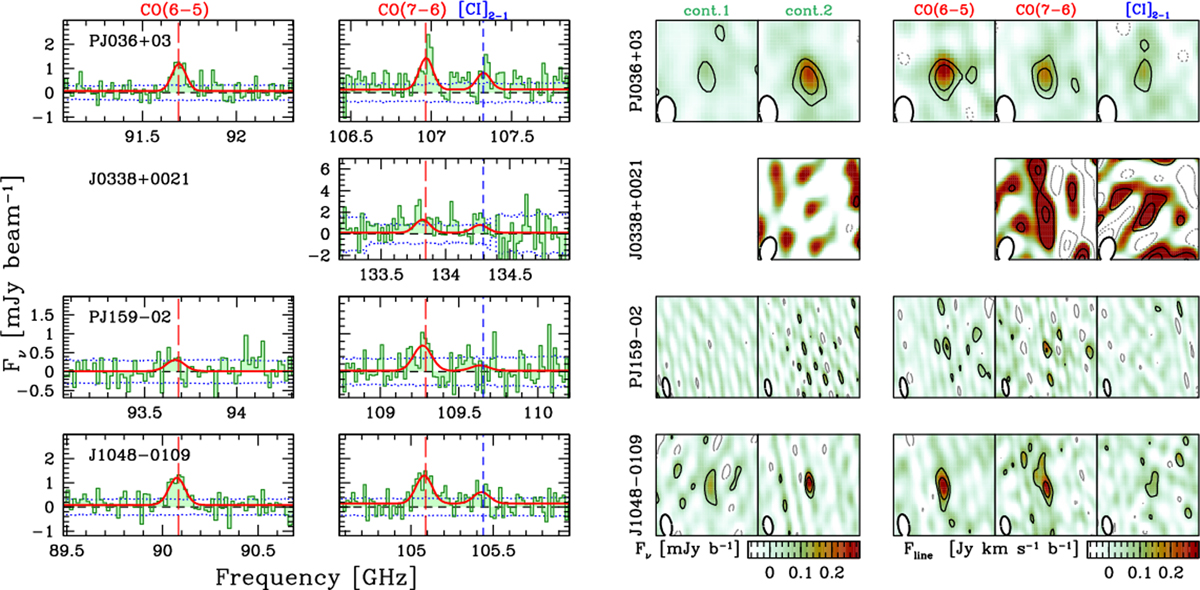
Fig. 1.
Download original image
IRAM PdBI and NOEMA spectra and images of CO(6–5), CO(7–6), and [C I] in quasar host galaxies at z ∼ 6. In the spectra, the dotted histograms mark the ±1σ range in the rms noise. The vertical red long-dashed and blue short-dashed lines mark the expected frequencies of the CO and [C I] transitions, respectively. The thick red lines show the best fit model of the spectra. In the right panels, the two continuum images were obtained by integrating over all of the line–free channels in the lower (1) and upper (2) side bands. The line maps are obtained by integrating over the observed or expected line width (see text for details). All the panels are 20″ × 20″ wide centered on the quasars. North is on the top, and east is on the left-hand side. Black and gray contours show the ±2,4,8,16-σ isophotes. The synthesized beam is shown as a white ellipse at the bottom left corner of the images.
Current usage metrics show cumulative count of Article Views (full-text article views including HTML views, PDF and ePub downloads, according to the available data) and Abstracts Views on Vision4Press platform.
Data correspond to usage on the plateform after 2015. The current usage metrics is available 48-96 hours after online publication and is updated daily on week days.
Initial download of the metrics may take a while.