Open Access
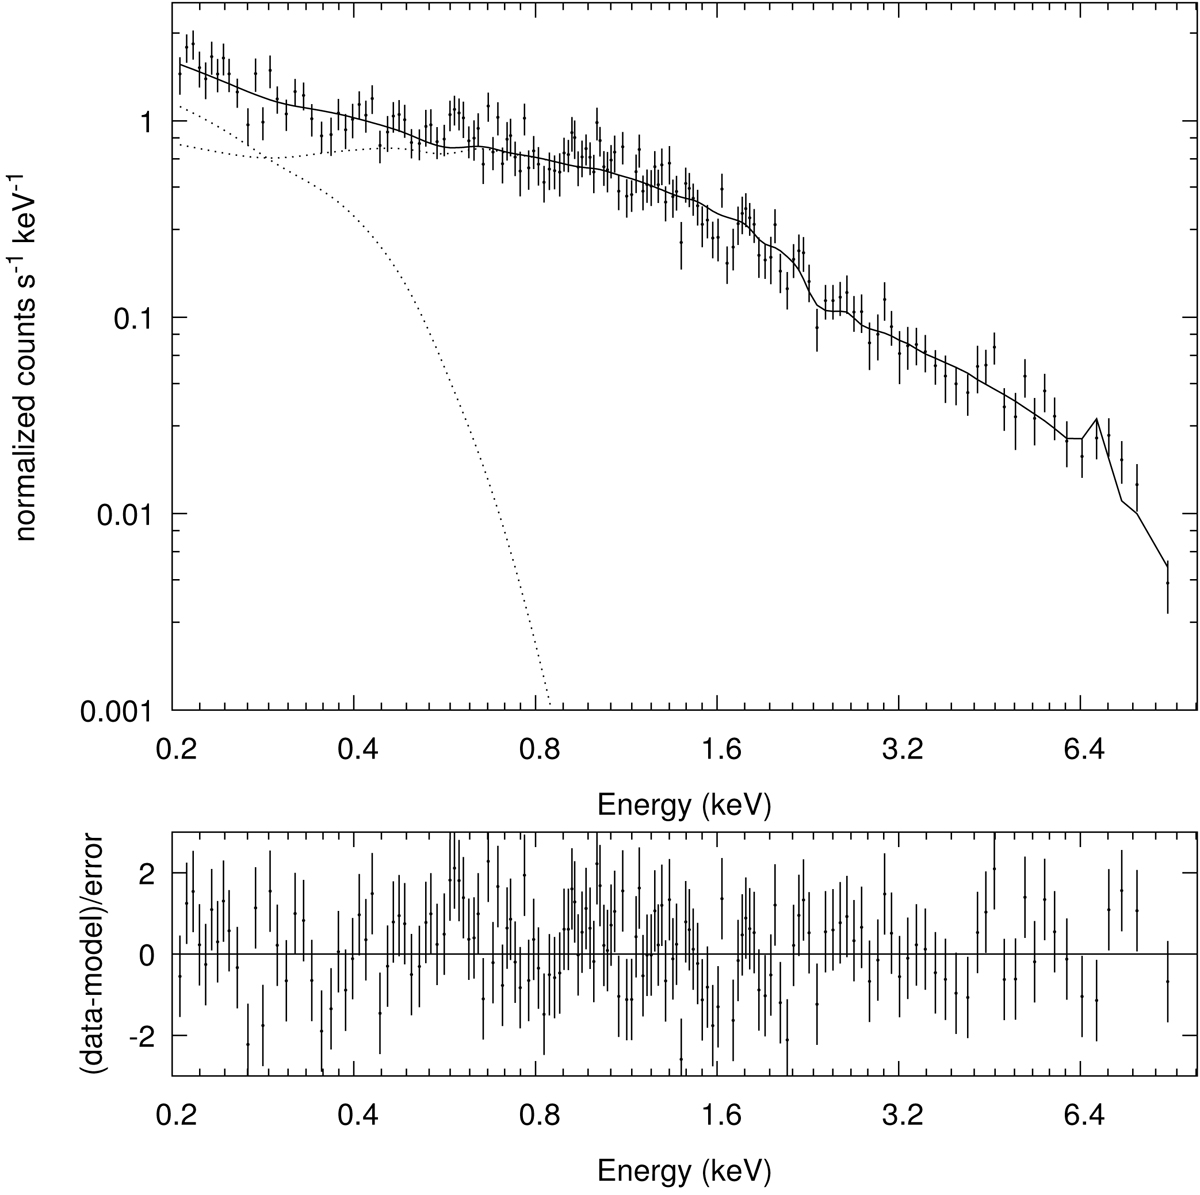
Fig. 8.
Download original image
X-ray spectrum of V496 UMa. The spectrum was extracted from the first bright humps and grouped with 25 counts per bin using TBABS(BB+MEKAL) spectral models. The reduced chi-square value is 1.15.
Current usage metrics show cumulative count of Article Views (full-text article views including HTML views, PDF and ePub downloads, according to the available data) and Abstracts Views on Vision4Press platform.
Data correspond to usage on the plateform after 2015. The current usage metrics is available 48-96 hours after online publication and is updated daily on week days.
Initial download of the metrics may take a while.