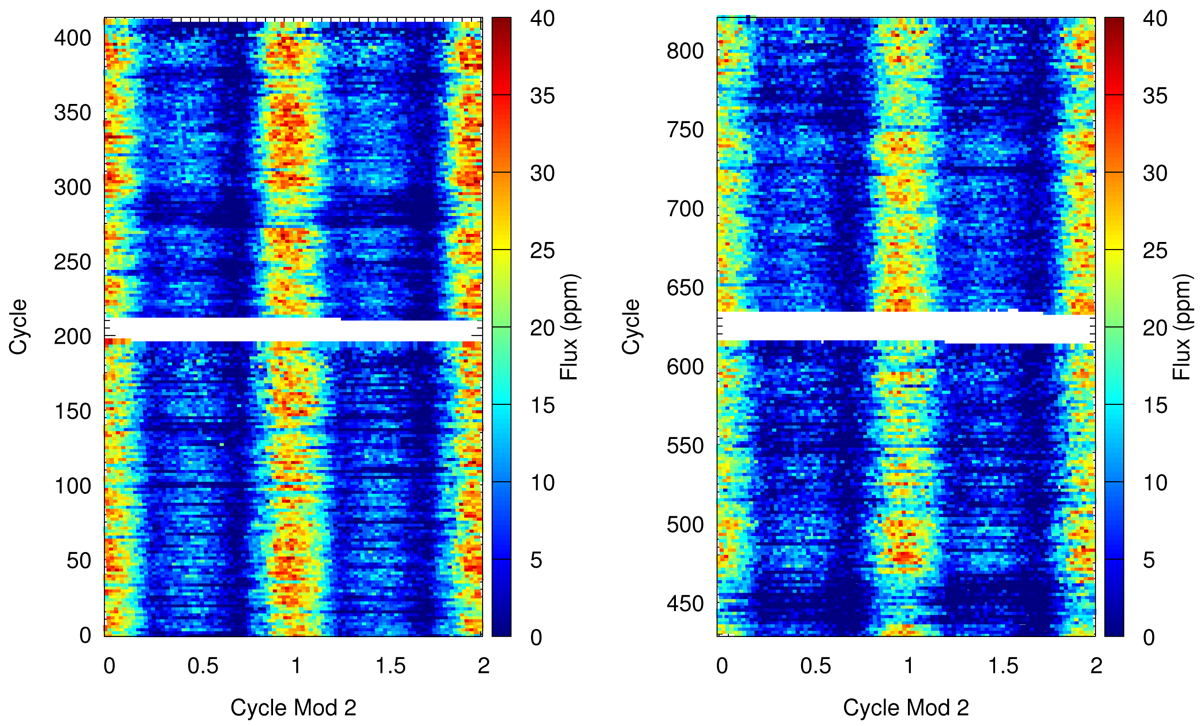
Fig. 4.
Download original image
Cycle–Cycle Mod 2 diagram of V496 UMa for all high-cadence TESS data. Two consecutive cycles are drawn consecutively from the beginning. The color bar shows the flux density. The left panel shows data obtained in sector 15; the right panel shows data obtained in sector 16. All data were folded using the ephemeris given in Eq. (1). The wide white gaps in the two graphs show where TESS did not receive data.
Current usage metrics show cumulative count of Article Views (full-text article views including HTML views, PDF and ePub downloads, according to the available data) and Abstracts Views on Vision4Press platform.
Data correspond to usage on the plateform after 2015. The current usage metrics is available 48-96 hours after online publication and is updated daily on week days.
Initial download of the metrics may take a while.