Fig. 12.
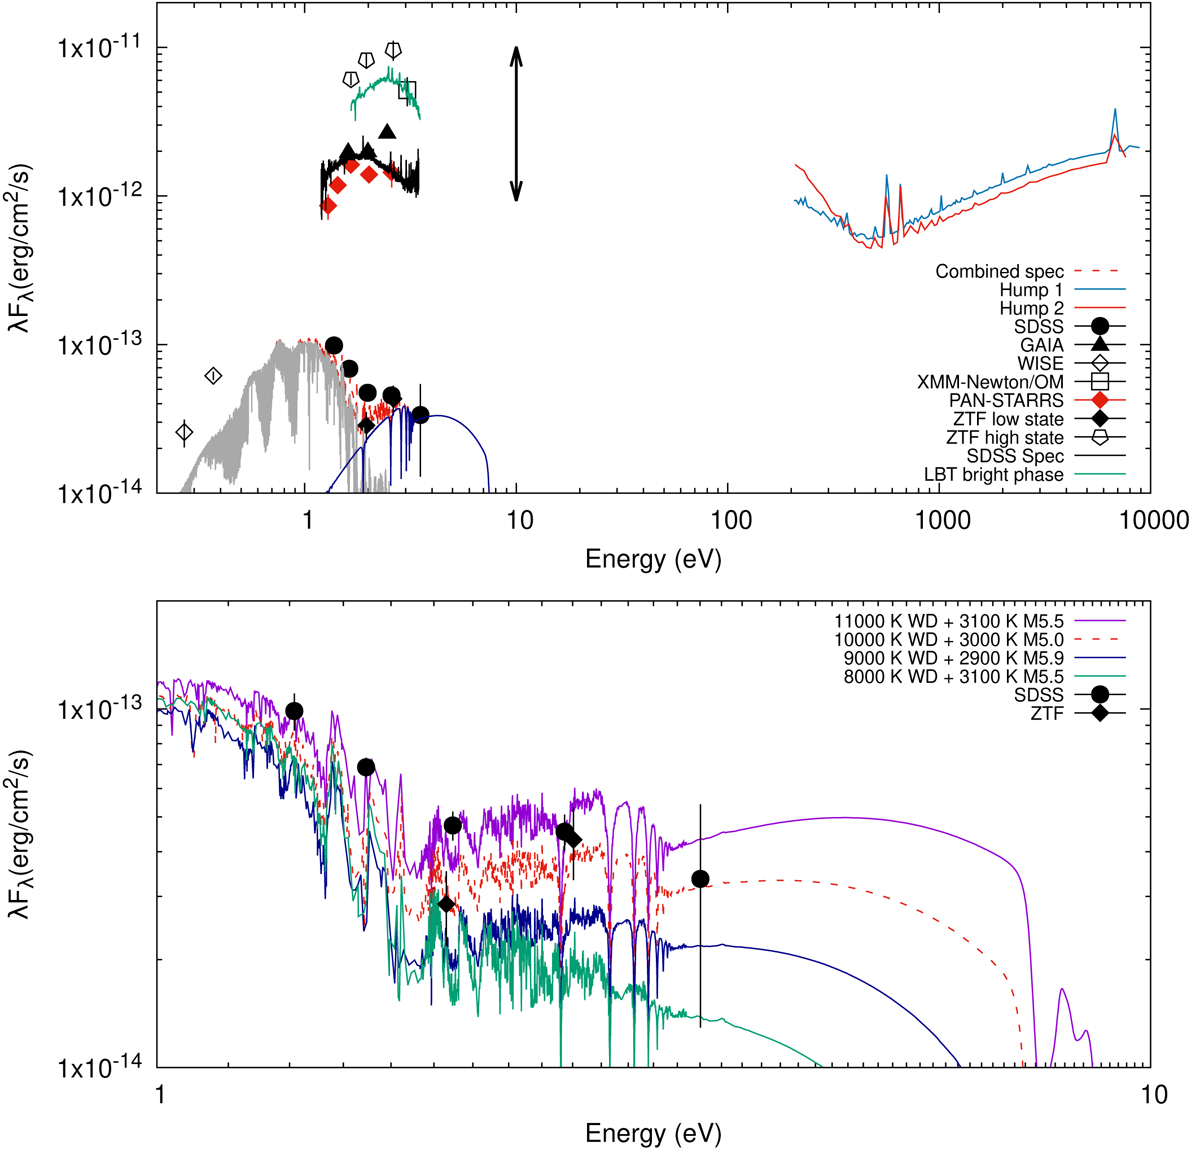
Download original image
The spectral energy distribution of V496 UMa. Upper panel: total spectral energy distribution of V496 UMa from the X-ray to the infrared region. White dwarf (0.8 M⊙) (dark blue line) and main-sequence star (0.16 M⊙) (light gray line) model spectra for 10 000 K and 3000 K, are shown combined with a red dashed line. The vertically plotted black arrow represents the amplitude of the high-state light curve in ZTF which derived from long-term g band light curve(16–18.6 mag) (see Fig. 11). Lower panel: points in the optical region and combined synthetic atmosphere models used to estimate the temperatures of the components.
Current usage metrics show cumulative count of Article Views (full-text article views including HTML views, PDF and ePub downloads, according to the available data) and Abstracts Views on Vision4Press platform.
Data correspond to usage on the plateform after 2015. The current usage metrics is available 48-96 hours after online publication and is updated daily on week days.
Initial download of the metrics may take a while.