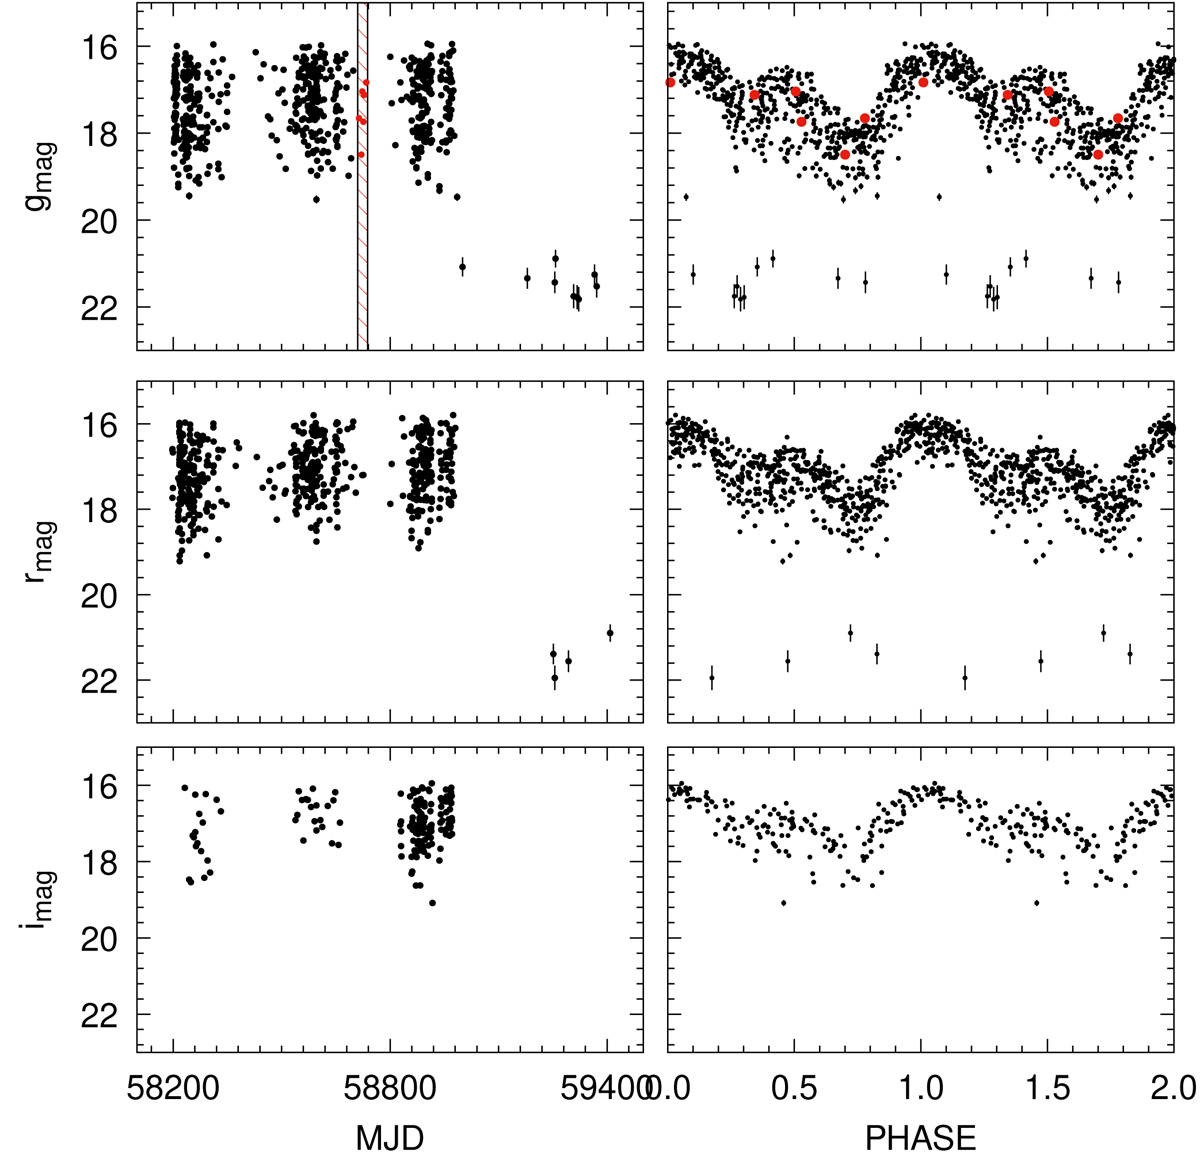
Fig. 11.
Download original image
ZTF observations in time series with different passbands (left) and folded light curves of these time series according to Eq. (1) (right). The interval (dashed red box) in the upper left figure shows the time when TESS observations were made. The ZTF observations at this time are given by the red dots. The phase-folded figure on the right shows the location of these dots.
Current usage metrics show cumulative count of Article Views (full-text article views including HTML views, PDF and ePub downloads, according to the available data) and Abstracts Views on Vision4Press platform.
Data correspond to usage on the plateform after 2015. The current usage metrics is available 48-96 hours after online publication and is updated daily on week days.
Initial download of the metrics may take a while.