Fig. 3.
Download original image
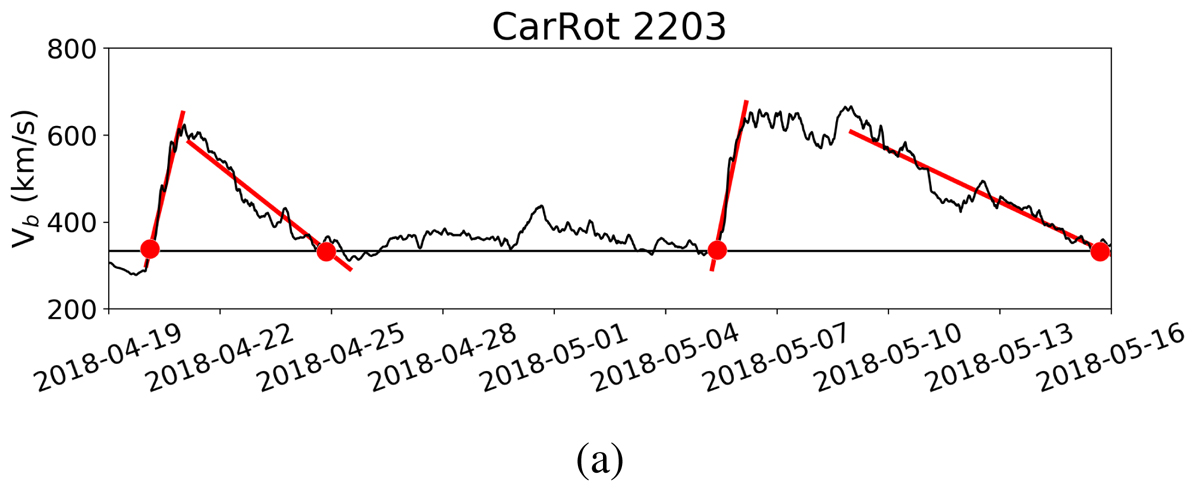
Example of how the HSS duration at Earth was estimated for two HSSs of our sample recorded during Carrington Rotation 2203. The ascending and descending phase of each HSS were linearly fitted (red lines). The intersection of these red lines with the mean background solar wind (red circles) indicate the arrival and end times of each HSS, based on which the HSS durations were calculated.
Current usage metrics show cumulative count of Article Views (full-text article views including HTML views, PDF and ePub downloads, according to the available data) and Abstracts Views on Vision4Press platform.
Data correspond to usage on the plateform after 2015. The current usage metrics is available 48-96 hours after online publication and is updated daily on week days.
Initial download of the metrics may take a while.