Fig. 2.
Download original image
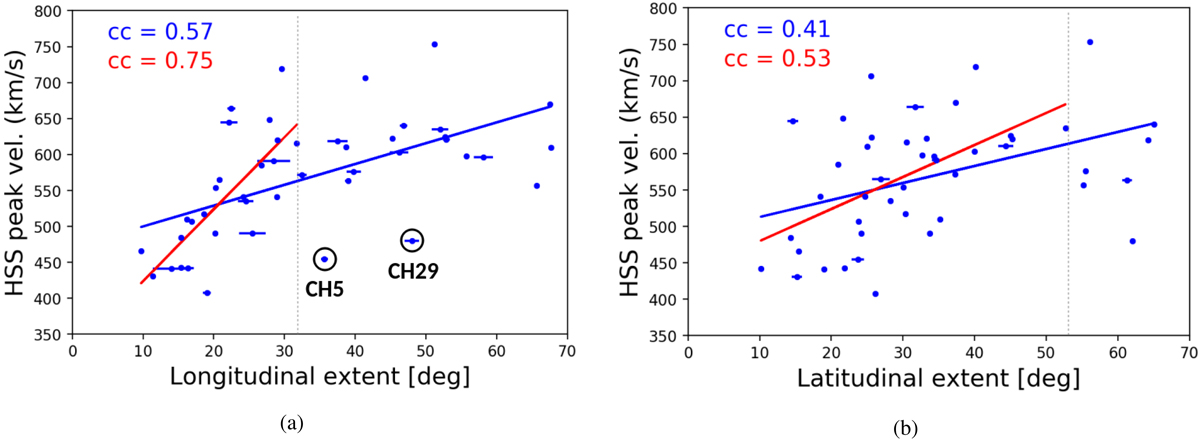
HSS peak velocity as a function of the CH longitudinal extent (panel a) and latitudinal extent (panel b). A linear regression line (red color) was fitted up until the point that the highest cc was achieved. A second linear regression line (blue color) was fitted to the whole sample. The gray dotted line separates the two clusters and sets the threshold beyond which, regardless of the CH longitude or latitude growth, the HSS peak velocity does not increase further. In panel a, we marked CH5 and CH29 as outliers with high longitudinal widths, but low HSS peak speeds at Earth.
Current usage metrics show cumulative count of Article Views (full-text article views including HTML views, PDF and ePub downloads, according to the available data) and Abstracts Views on Vision4Press platform.
Data correspond to usage on the plateform after 2015. The current usage metrics is available 48-96 hours after online publication and is updated daily on week days.
Initial download of the metrics may take a while.