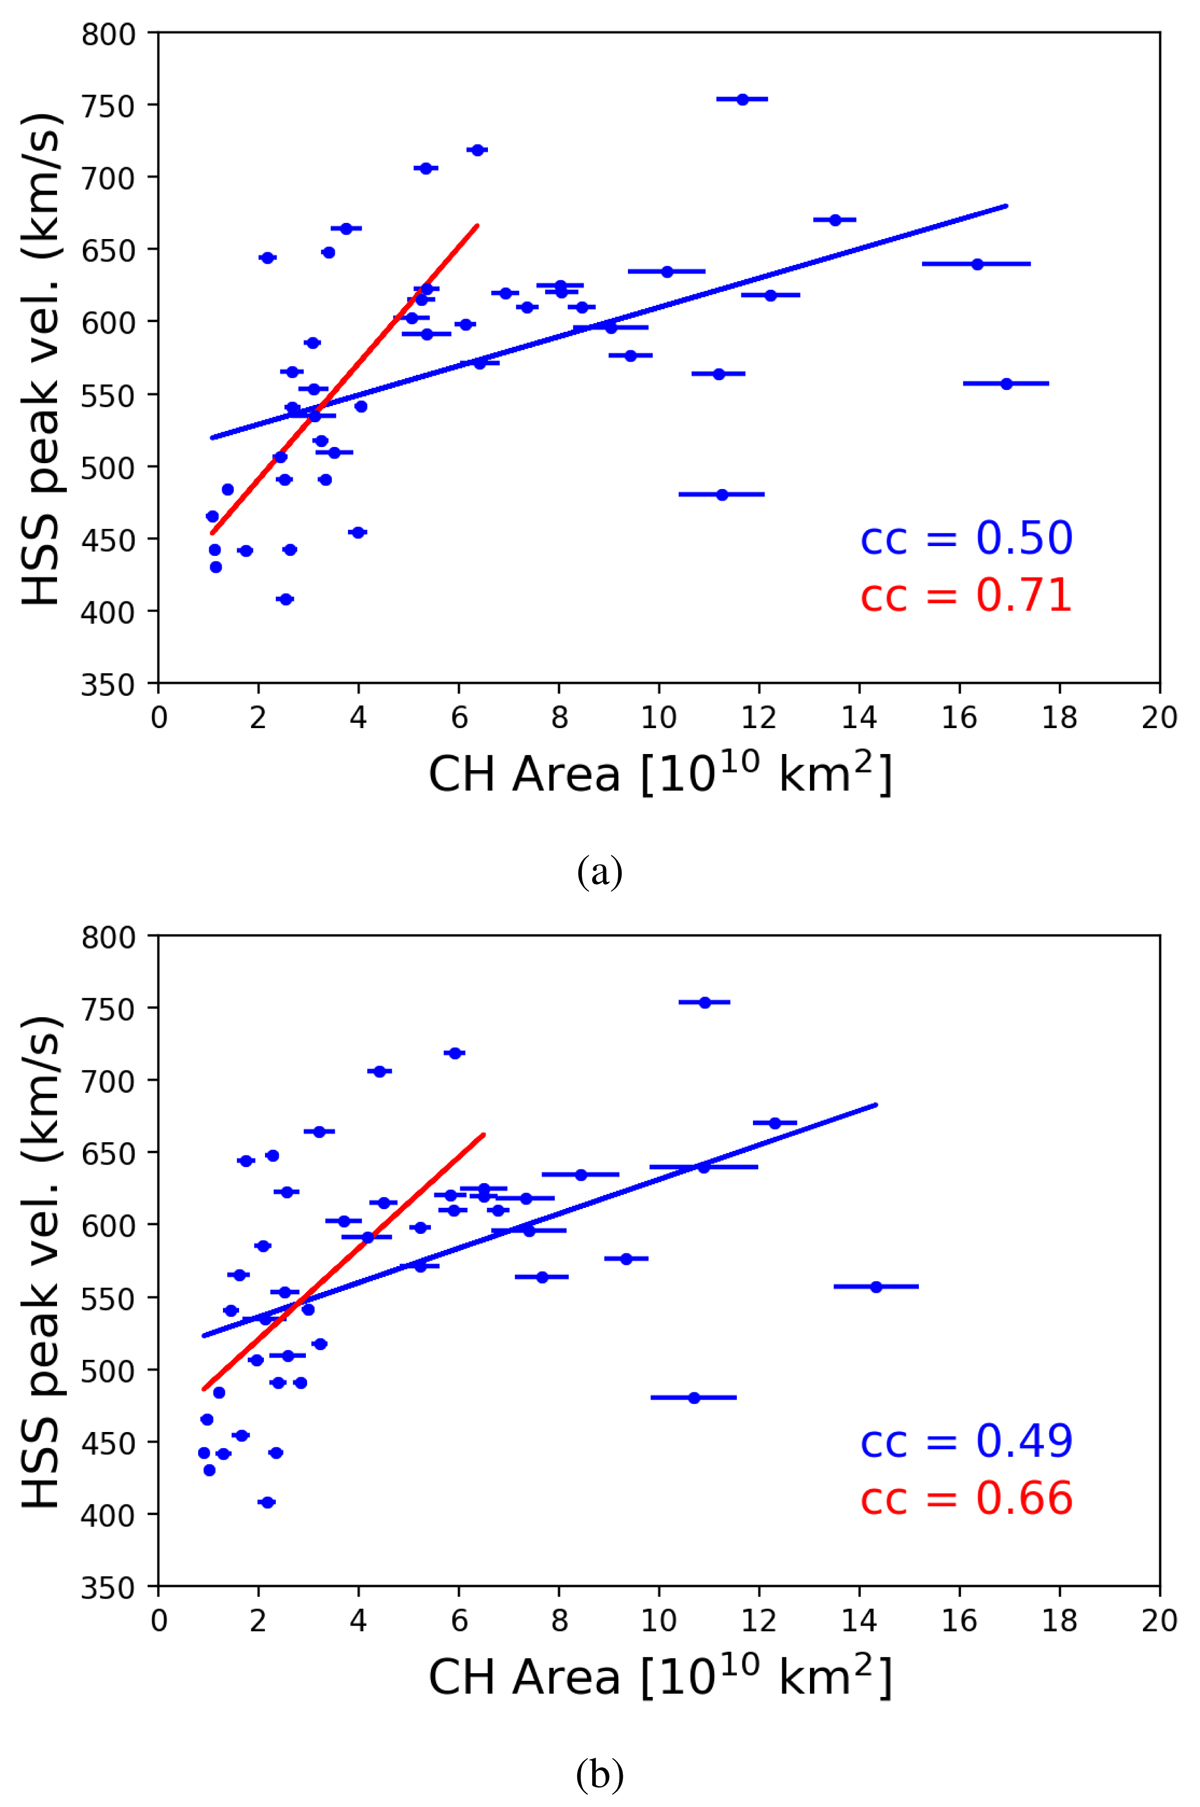
Fig. B.1.
Download original image
HSS peak velocity as a function of the CH area. Panel a,c: Linear regression line fitted for the whole sample. Panel b,d: Linear regression line fitted up until the point that the highest cc was achieved. The top and bottom plots show the bulk speed versus CH area relationship without and with applying the Hofmeister et al. (2018) correction, respectively.
Current usage metrics show cumulative count of Article Views (full-text article views including HTML views, PDF and ePub downloads, according to the available data) and Abstracts Views on Vision4Press platform.
Data correspond to usage on the plateform after 2015. The current usage metrics is available 48-96 hours after online publication and is updated daily on week days.
Initial download of the metrics may take a while.