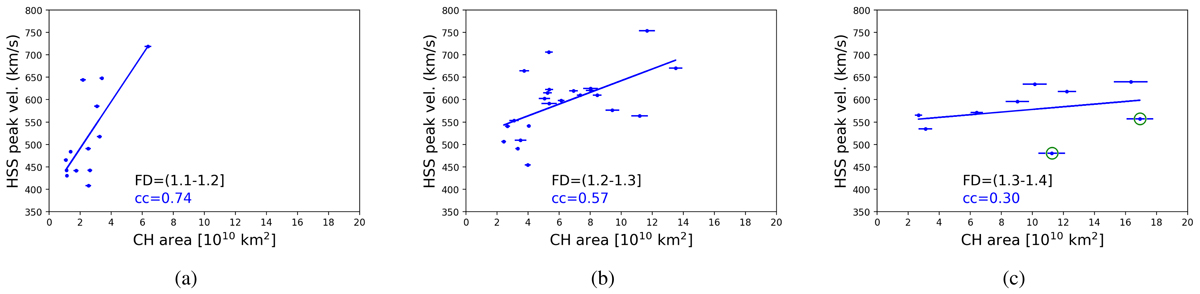
Fig. 13.
Download original image
HSS peak velocity as a function of the CH area for different FD ranges, going from the least complex (panel a) to the most complex (panel c) CHs. Green circles in panel c indicate the points responsible for the second peak observed in the Pearson’s cc distribution after the application of the bootstrapping technique (Fig. C.1c). For more details, see the main text.
Current usage metrics show cumulative count of Article Views (full-text article views including HTML views, PDF and ePub downloads, according to the available data) and Abstracts Views on Vision4Press platform.
Data correspond to usage on the plateform after 2015. The current usage metrics is available 48-96 hours after online publication and is updated daily on week days.
Initial download of the metrics may take a while.