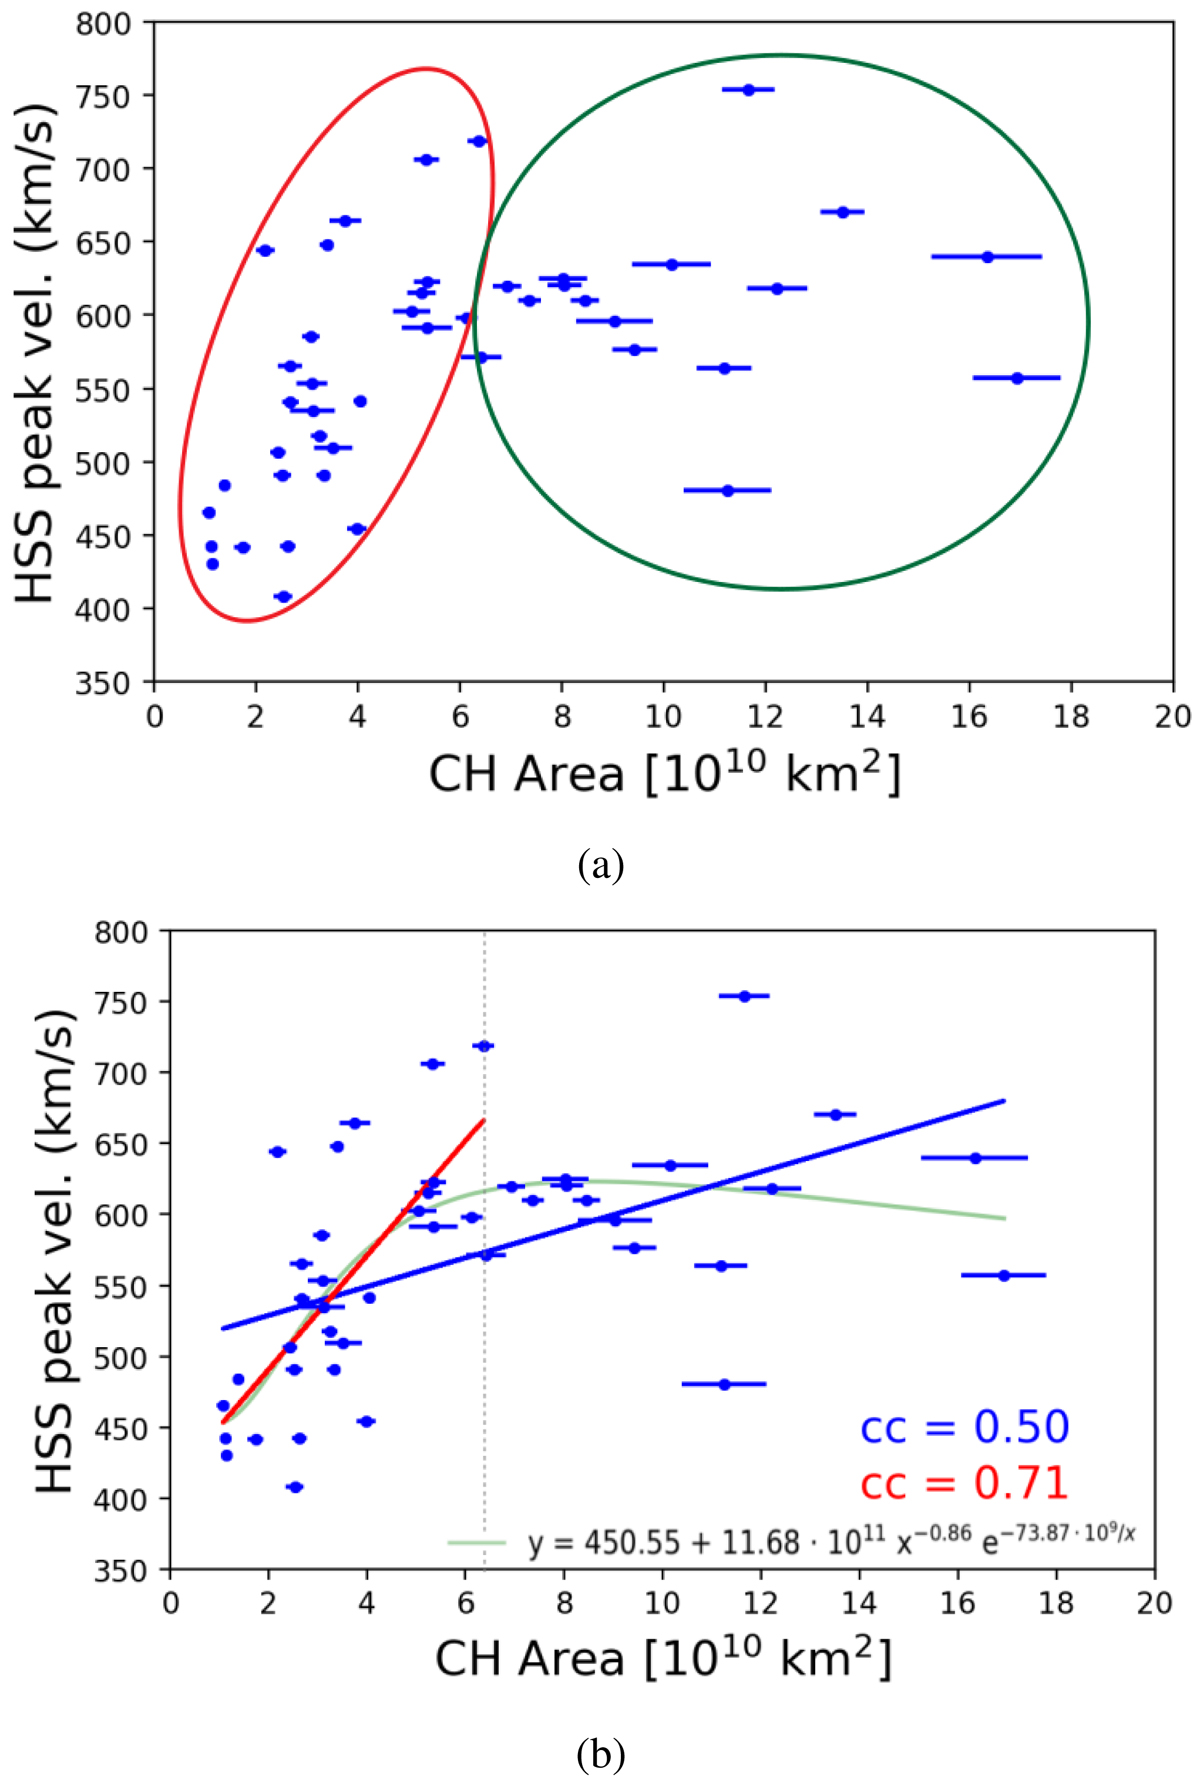
Fig. 1.
Download original image
HSS peak velocity as a function of the CH area. Panel a: red and green ovals divide our CH sample into two different groups. Panel b: fits for the different CH groups. The blue line shows the linear fit applied to the whole sample, while the red line is the linear fit applied for the subset that provided the highest cc. The gray dotted line separates the two groups and it sets the threshold beyond which the HSS peak velocity does not increase with an increasing CH area. The light green line corresponds to a power-exponential fit for all points and confirms the physical threshold in velocities.
Current usage metrics show cumulative count of Article Views (full-text article views including HTML views, PDF and ePub downloads, according to the available data) and Abstracts Views on Vision4Press platform.
Data correspond to usage on the plateform after 2015. The current usage metrics is available 48-96 hours after online publication and is updated daily on week days.
Initial download of the metrics may take a while.