Fig. 1
Download original image
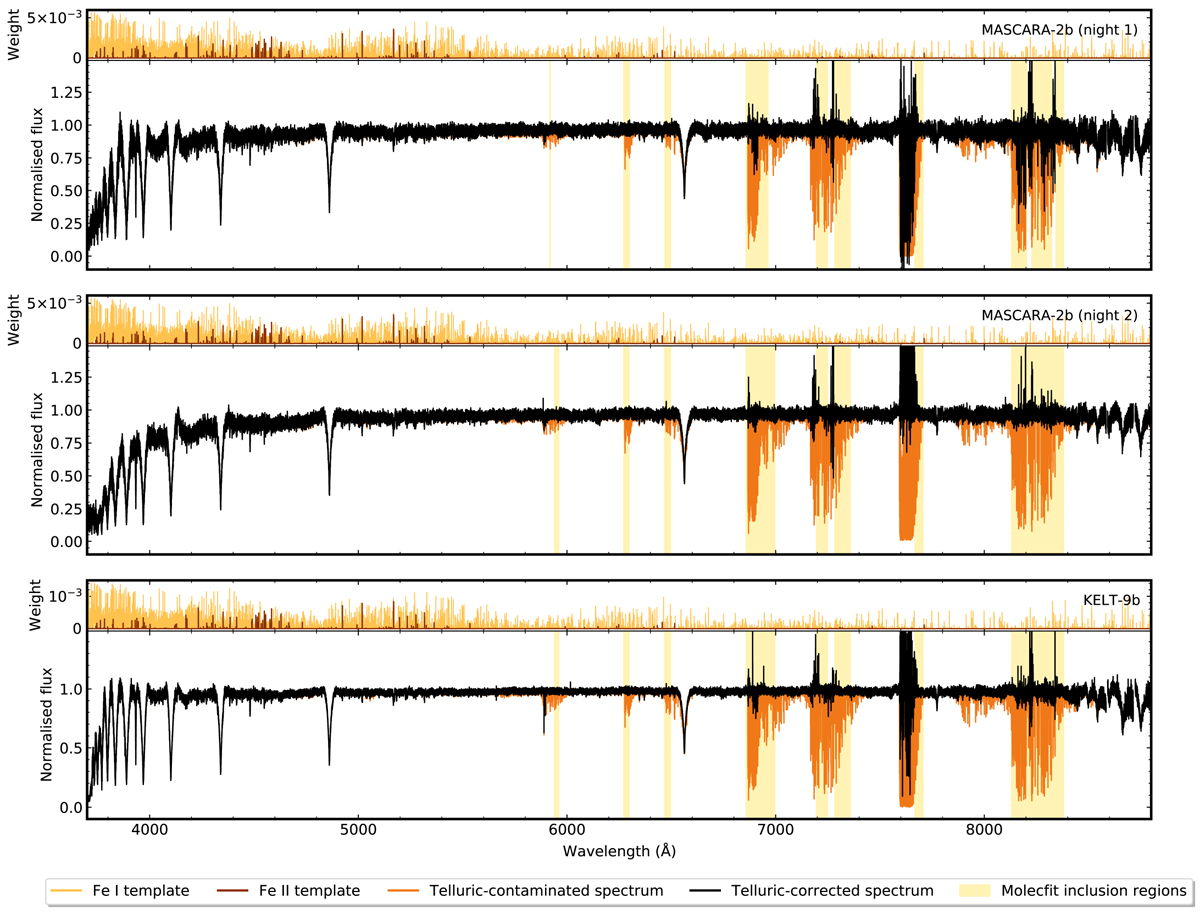
Three sample spectra (MASCARA-2 b in the top and middle panels, KELT-9 b in the bottom panel) before and after telluric correction with molecfit. Above each spectrum, we include the Fe I and Fe II model templates used in the cross-correlation analysis. While most Fe II spectral lines concentrate at short wavelengths, telluric lines abound at long wavelengths.
Current usage metrics show cumulative count of Article Views (full-text article views including HTML views, PDF and ePub downloads, according to the available data) and Abstracts Views on Vision4Press platform.
Data correspond to usage on the plateform after 2015. The current usage metrics is available 48-96 hours after online publication and is updated daily on week days.
Initial download of the metrics may take a while.