Fig. C.1
Download original image
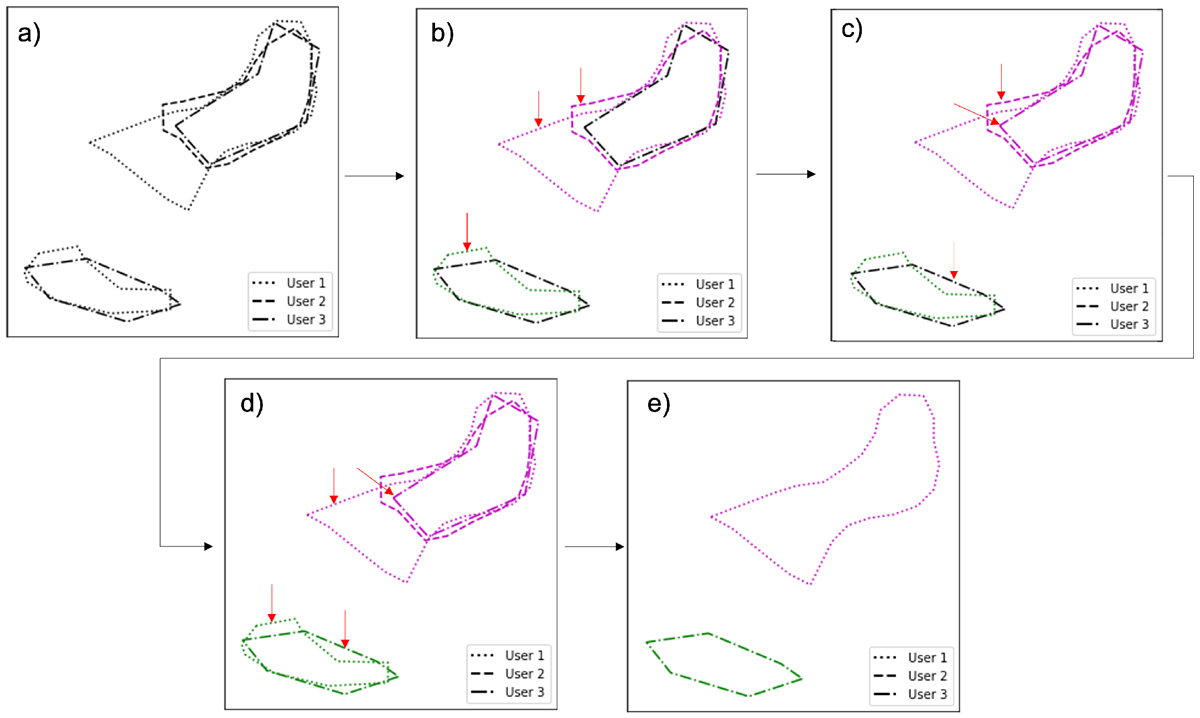
Illustration of the selection process for tidal tails and streams for one galaxy. Black annotations indicate that the unique identifier has not been attributed yet, while each color corresponds to one unique identifier. The linestyles correspond to the different users. The red arrows indicate which annotations are currently compared. a) Initialization: all the annotations of tidal tails and streams are considered. b) First iteration: the annotations of User 2 and User 1 are compared. c) Second iteration: comparison of the annotations of User 3 and User 2. d) Third iteration: comparison of the annotations of User 3 and User 1. e) Final step: for the annotations sharing the same unique identifier, only the one with the largest area is kept.
Current usage metrics show cumulative count of Article Views (full-text article views including HTML views, PDF and ePub downloads, according to the available data) and Abstracts Views on Vision4Press platform.
Data correspond to usage on the plateform after 2015. The current usage metrics is available 48-96 hours after online publication and is updated daily on week days.
Initial download of the metrics may take a while.