Fig. 4.
Download original image
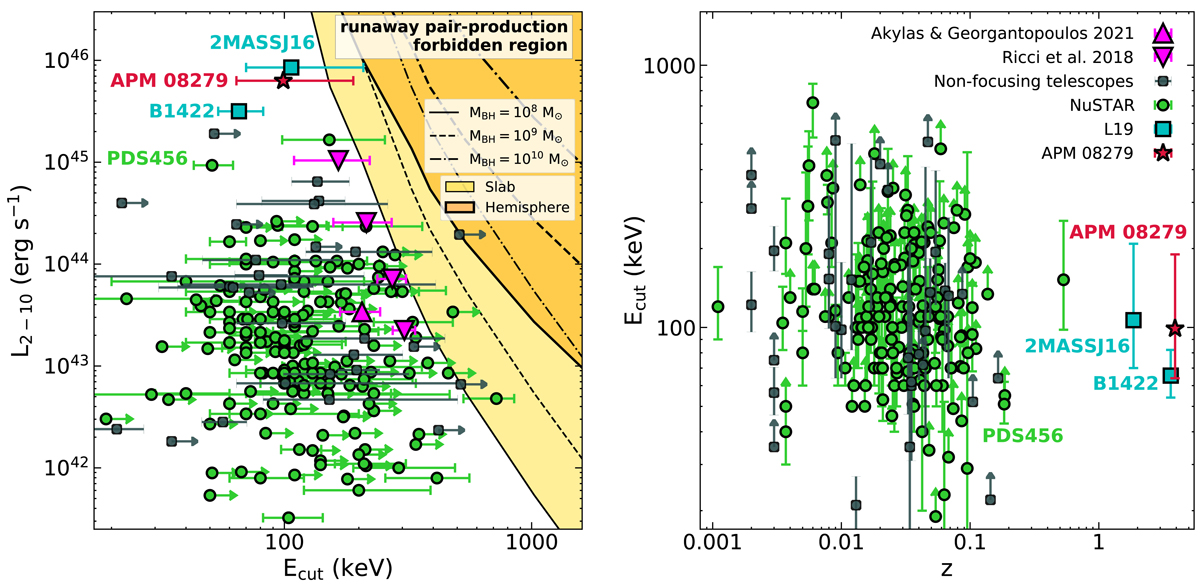
Compactness–temperature diagram translated into directly observable quantities and high-energy cutoff distribution as a function of redshift. Left: X-ray luminosity vs. high-energy cutoff, updated from L19 (see main text and Tables A.1–A.3 for details). NuSTAR measurements are in green, non-focusing telescopes’ in grey, high-z AGN from L19 in cyan, and our measurement in red. Magenta downward triangles mark the averaged values for BASS AGN from Ricci et al. (2018), while the magenta upward triangle marks the median point of Seyfert 1 galaxies from Akylas & Georgantopoulos (2021). Yellow (orange) areas delimited by a thin (thick) line show the runaway pair-production region for a 108 M⊙ SMBH in the case of slab (hemisphere) geometry. Dashed (dashed-dotted) lines mark the same thresholds for a 109 M⊙ (1010 M⊙) SMBH. Right: high-energy cutoff vs. redshift plane for the same samples as in the left panel.
Current usage metrics show cumulative count of Article Views (full-text article views including HTML views, PDF and ePub downloads, according to the available data) and Abstracts Views on Vision4Press platform.
Data correspond to usage on the plateform after 2015. The current usage metrics is available 48-96 hours after online publication and is updated daily on week days.
Initial download of the metrics may take a while.