Fig. 3.
Download original image
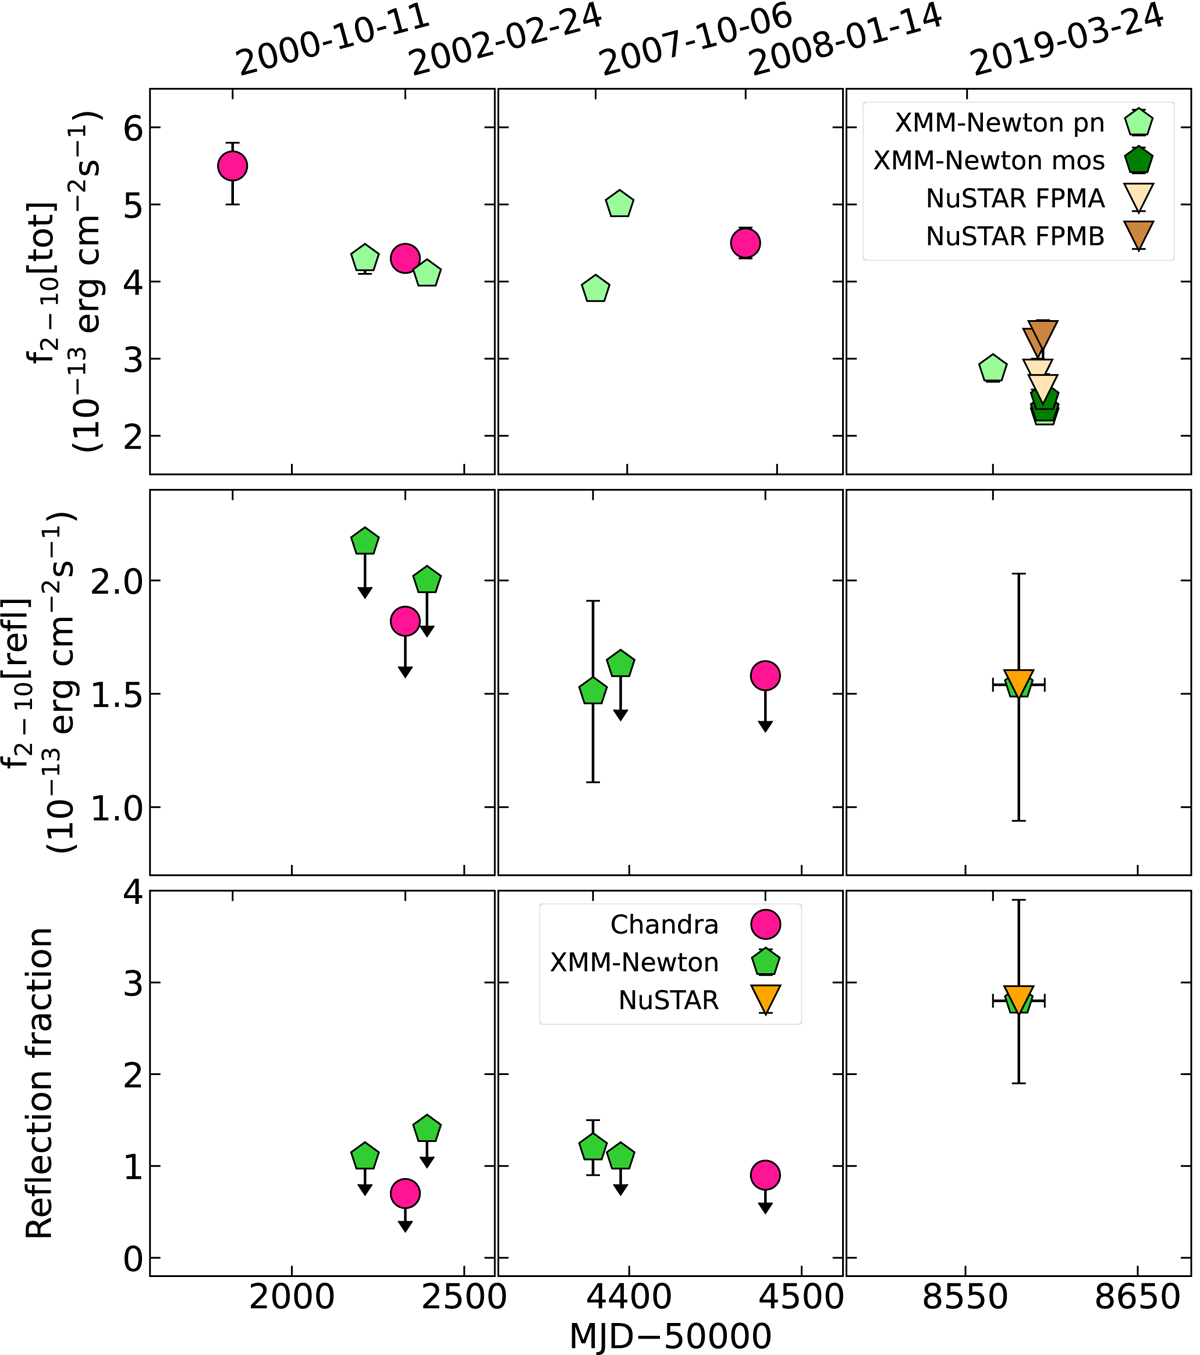
Variation of 2−10 keV observed-band total source flux (top panel), 2−10 keV observed-band flux of the reflection component alone (middle panel) and reflection fraction R (bottom panel), of Chandra (magenta circles), XMM-Newton (light, dark and medium green pentagons for EPIC pn, EPIC MOS, and EPIC pn+MOS, respectively) and NuSTAR (ivory, brown, orange triangles for FPMA, FPMB, and FPMA+FPMB, respectively) data from year 2000 to 2019. Top axis shows the dates, bottom axis the modified Julian dates. Top panel: values up to 2009 are taken from C09, the first two points are evaluated from re-analyzed data. Errors are given at 68% confidence, as in C09. When they are not visible, errorbars are smaller than the point size. Middle panel: upper limits are computed using the 90% upper limit of the reflection fraction. Bottom panel: upper limits are computed at 90% confidence level. The first Chandra observation (i.e., the shortest one – see main text) is left out due to the low count statistics.
Current usage metrics show cumulative count of Article Views (full-text article views including HTML views, PDF and ePub downloads, according to the available data) and Abstracts Views on Vision4Press platform.
Data correspond to usage on the plateform after 2015. The current usage metrics is available 48-96 hours after online publication and is updated daily on week days.
Initial download of the metrics may take a while.