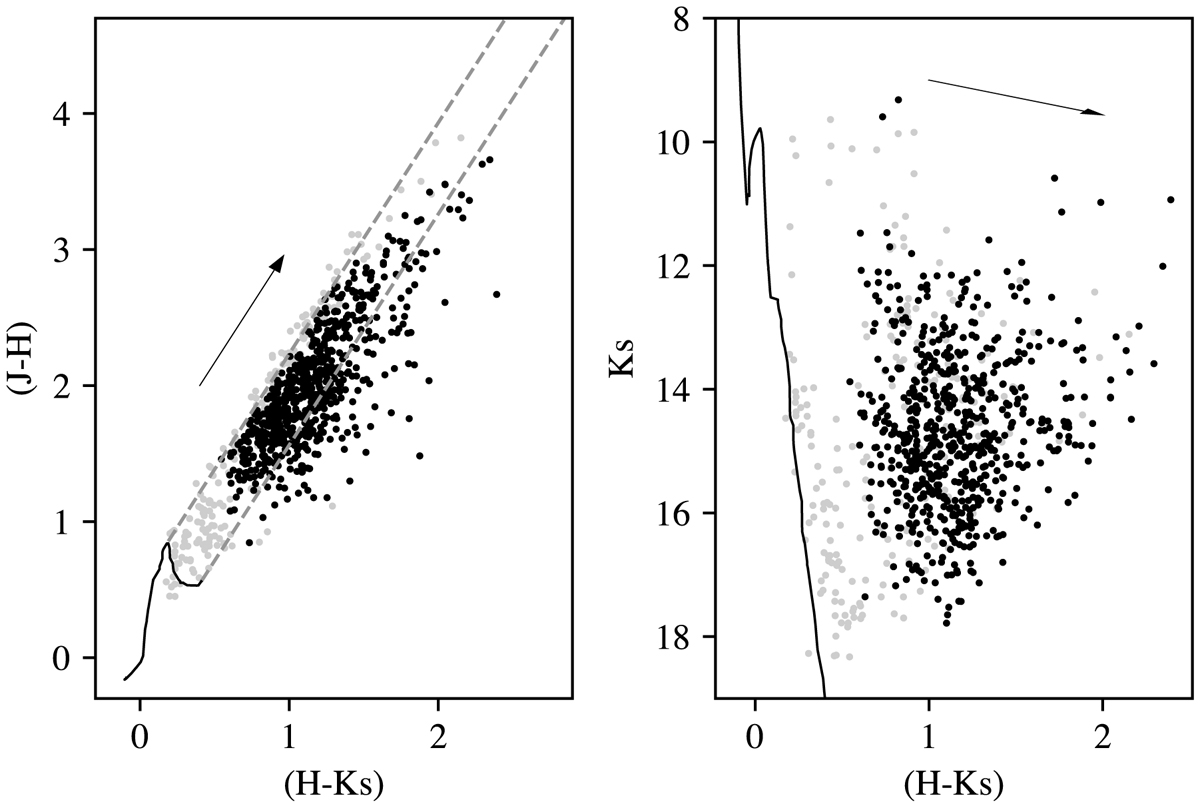
Fig. 4.
Download original image
(J − H) vs. (H − Ks) color-color diagram and KS vs. (H − KS) color-magnitude diagram for the observed sources. The black symbols correspond to the sources that are probably cluster members (see Sect. 5.1), and the gray symbols correspond to the remaining sources in the field of view (contaminants). The solid lines in both diagrams represent the adopted models for an age of 1 Myr and a distance of 1.5 kpc. The arrows show the displacement caused by an extinction of 1 mag in KS according to the assumed extinction law (see Sect. 2.1). The dashed lines show the limits of the reddening band in the color-color diagram, defined by the reddening vector and the extreme ends of the model isochrones in color.
Current usage metrics show cumulative count of Article Views (full-text article views including HTML views, PDF and ePub downloads, according to the available data) and Abstracts Views on Vision4Press platform.
Data correspond to usage on the plateform after 2015. The current usage metrics is available 48-96 hours after online publication and is updated daily on week days.
Initial download of the metrics may take a while.