Fig. 3.
Download original image
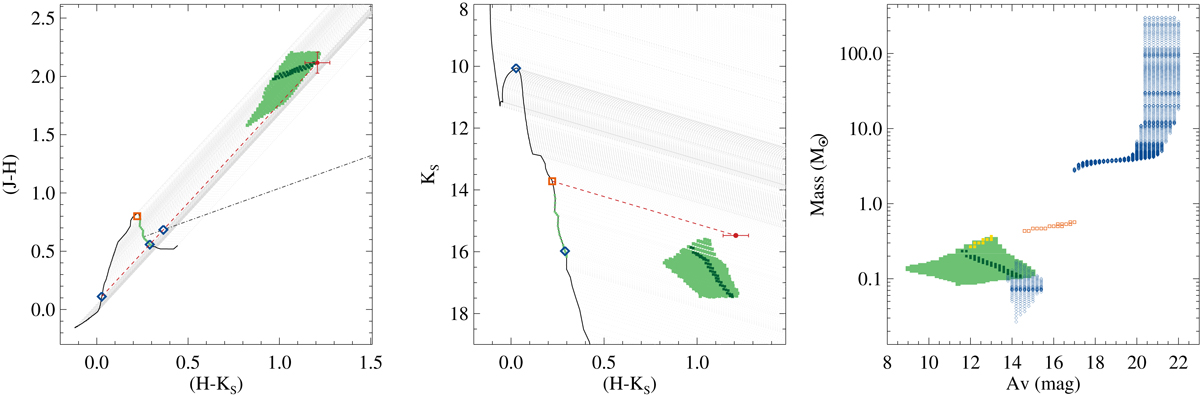
Estimating physical parameters in color-color and color-magnitude space (left and middle panels, respectively) for one example source inside the reddening band. The solid black lines show the pre-main-sequence evolutionary models in the two panels, and the dot-dashed black line shows the canonical CTTS locus of Meyer et al. (1997a) in the color-color diagram. The filled red circles and error bars mark the observed colors and KS magnitude of the source and its photometric errors in the two panels. The dashed red lines show the projection of the observed source toward the models along the appropriate reddening vectors for each panel. These lines intersect the models at the points marked with the blue diamonds in the CC diagram and at the points marked with the orange square in the CMD. The corresponding model points are marked with the same symbols in the two panels, showing that the two estimates do not overlap. The figure also shows the grid of reddened model points (light gray dots) described in Sect. 4. The green areas limit the range of reddened colors and magnitude that provides consistency across all diagrams by allowing for the presence of excess emission (see Sect. 4 for details). Right panel: corresponding ranges of mass and extinction for this example source. For all panels, the models are for an age of 1 Myr and a distance of 1.7 kpc.
Current usage metrics show cumulative count of Article Views (full-text article views including HTML views, PDF and ePub downloads, according to the available data) and Abstracts Views on Vision4Press platform.
Data correspond to usage on the plateform after 2015. The current usage metrics is available 48-96 hours after online publication and is updated daily on week days.
Initial download of the metrics may take a while.