Fig. 8.
Download original image
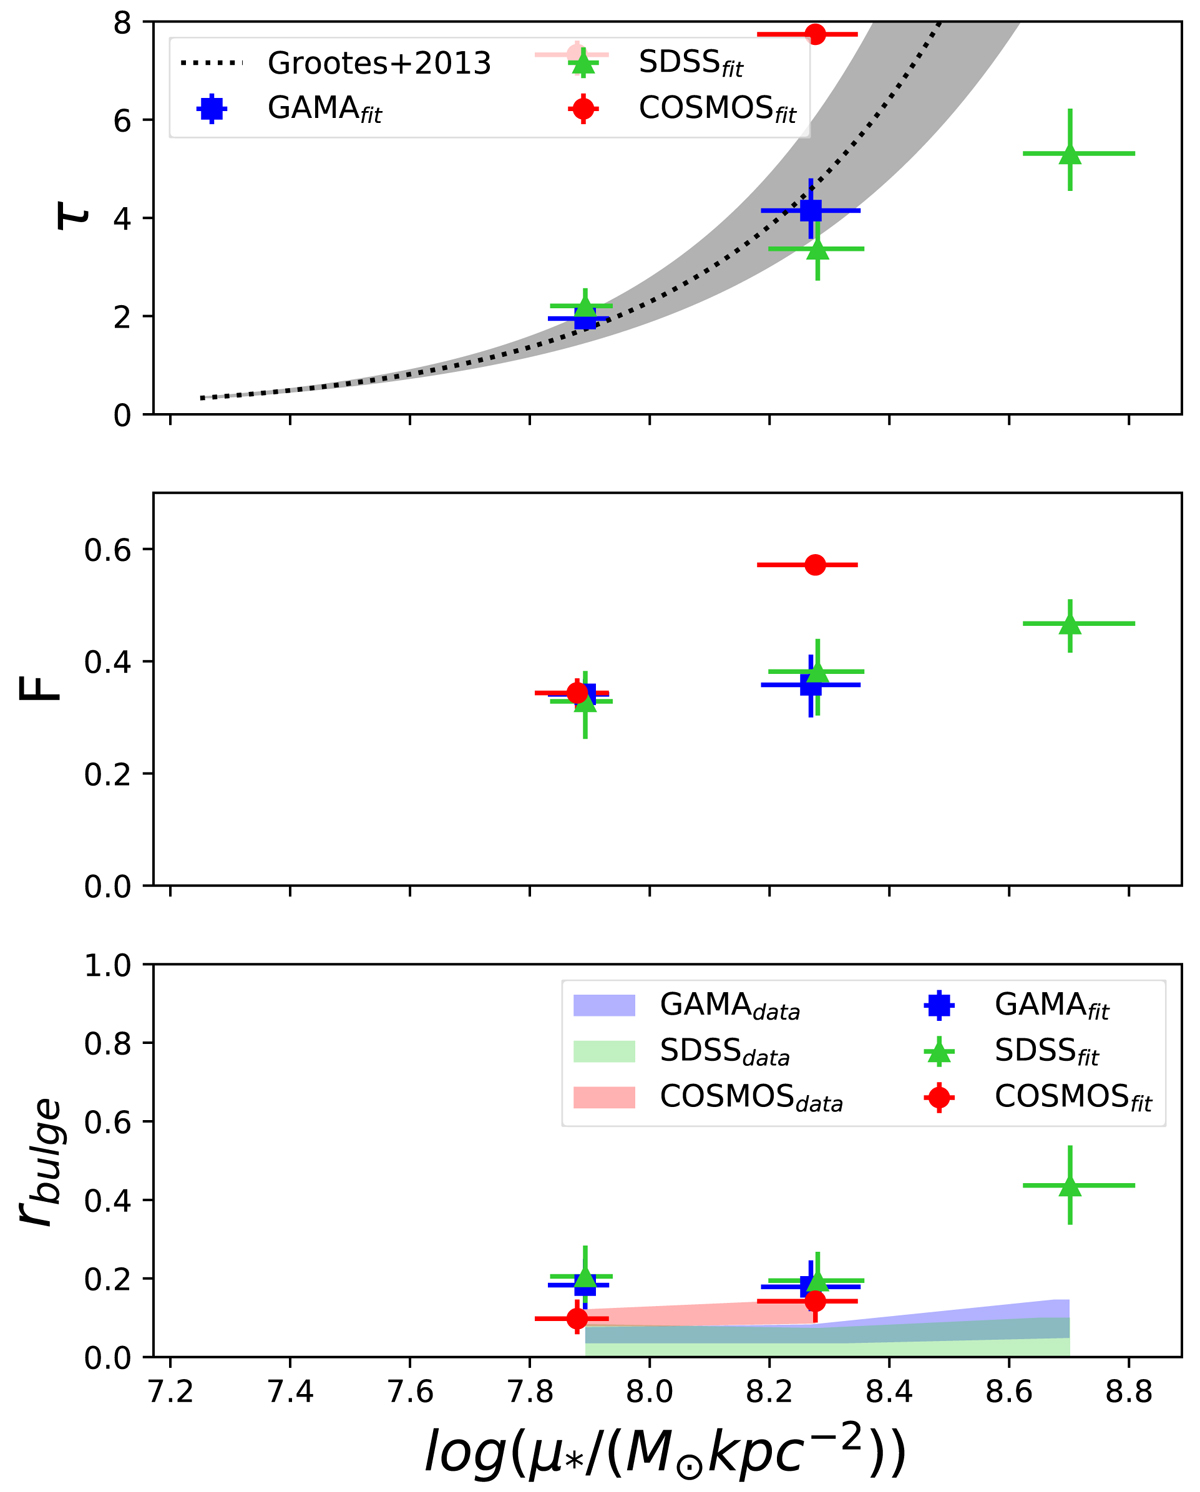
Best-fit values for ![]() , F and rbulge for galaxies in our datasets, divided in bins of μ*. We compare the fitted values for rbulge to the average and 32–68th percentile of the bulge-to-total distribution of the selected samples, labeled with the subscript “data”. The results show an increase
, F and rbulge for galaxies in our datasets, divided in bins of μ*. We compare the fitted values for rbulge to the average and 32–68th percentile of the bulge-to-total distribution of the selected samples, labeled with the subscript “data”. The results show an increase ![]() for an increase in μ*, similar to Grootes et al. (2013), given by the black dashed line and gray. The GAMA and COSMOS surveys do not contain enough high surface density galaxies to describe a clear magnitude-inclination relation, resulting in the model not obtaining fitting results at log(μ∗) ∼ 8.7 M⊙ kpc−2.
for an increase in μ*, similar to Grootes et al. (2013), given by the black dashed line and gray. The GAMA and COSMOS surveys do not contain enough high surface density galaxies to describe a clear magnitude-inclination relation, resulting in the model not obtaining fitting results at log(μ∗) ∼ 8.7 M⊙ kpc−2.
Current usage metrics show cumulative count of Article Views (full-text article views including HTML views, PDF and ePub downloads, according to the available data) and Abstracts Views on Vision4Press platform.
Data correspond to usage on the plateform after 2015. The current usage metrics is available 48-96 hours after online publication and is updated daily on week days.
Initial download of the metrics may take a while.