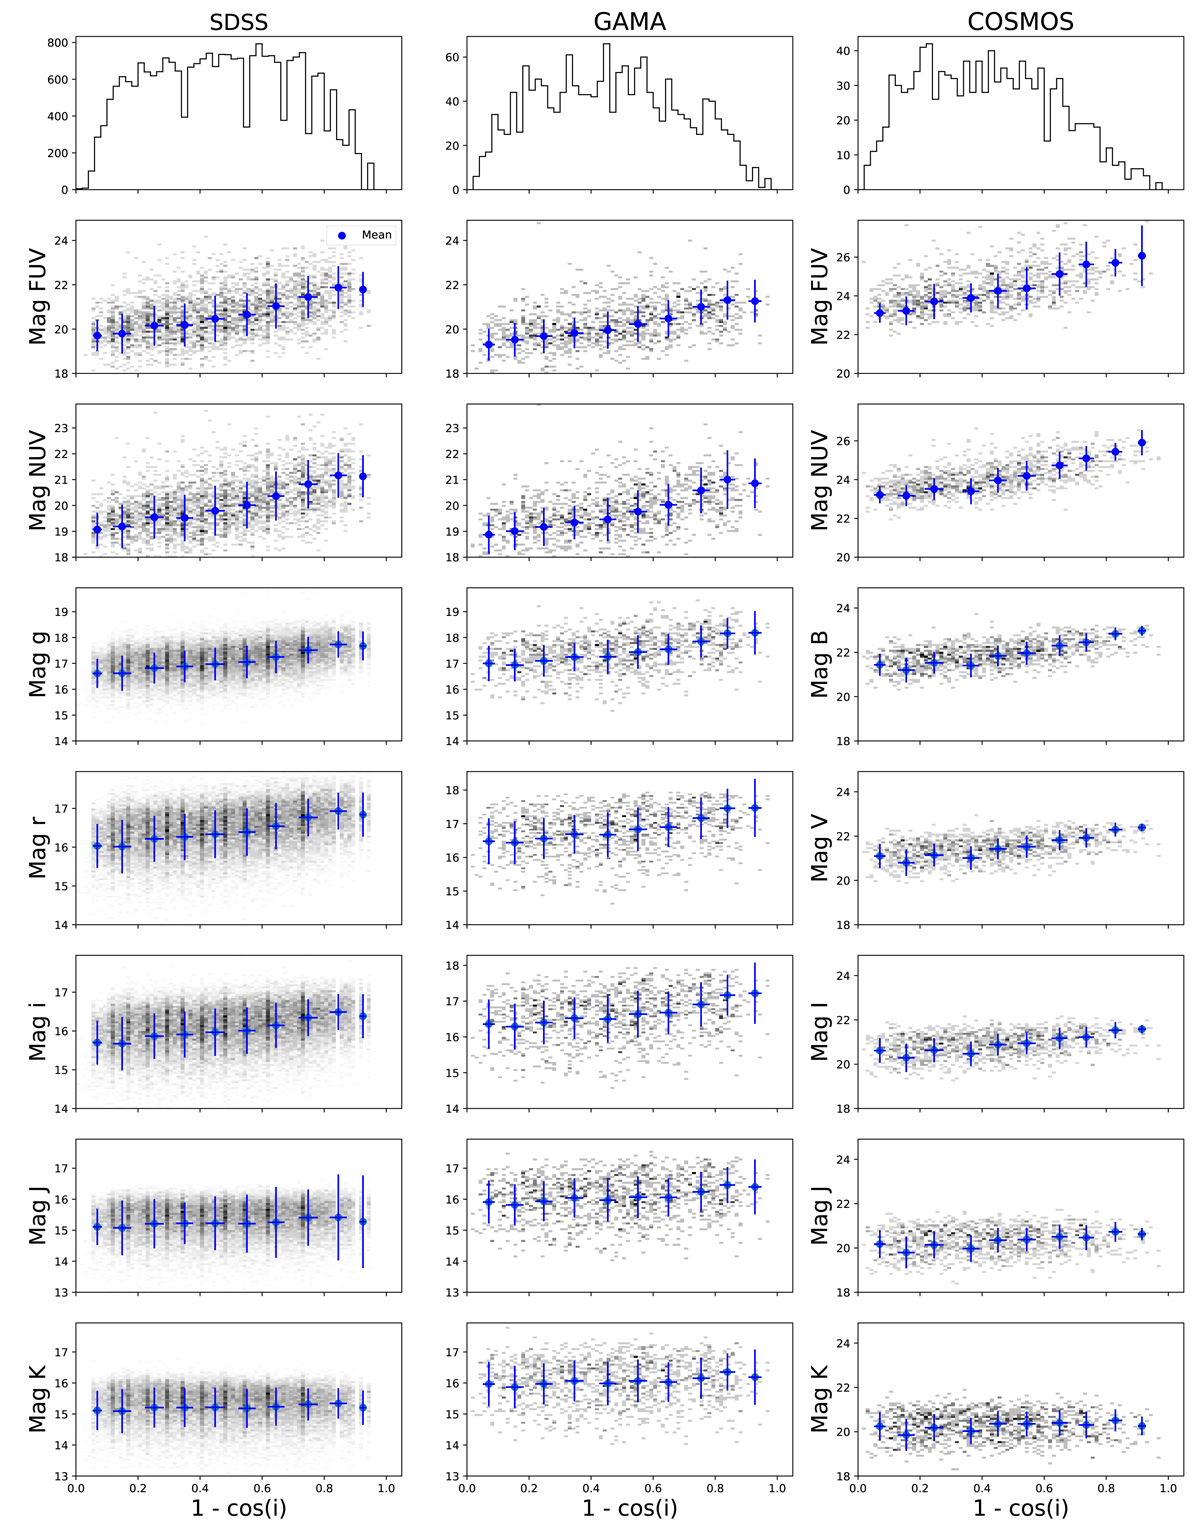
Fig. 3.
Download original image
Magnitude-inclination relations. Top row: inclination distribution of all selected star-forming galaxies in the three samples. The other panels show the magnitude-inclination relation for SDSS, GAMA, and COSMOS in rest-frame UV, optical, and NIR bands. The grayscale is a 2D histogram of all the galaxies with a signal-to-noise ratio > 3 in the respective band and the blue points show the mean values with the 32–68th percentile as errors in 10 bins of inclination using the importance sampling weights. We note that our sample selection does not require a galaxy to be detected in all photometric bands.
Current usage metrics show cumulative count of Article Views (full-text article views including HTML views, PDF and ePub downloads, according to the available data) and Abstracts Views on Vision4Press platform.
Data correspond to usage on the plateform after 2015. The current usage metrics is available 48-96 hours after online publication and is updated daily on week days.
Initial download of the metrics may take a while.