Fig. D.1.
Download original image
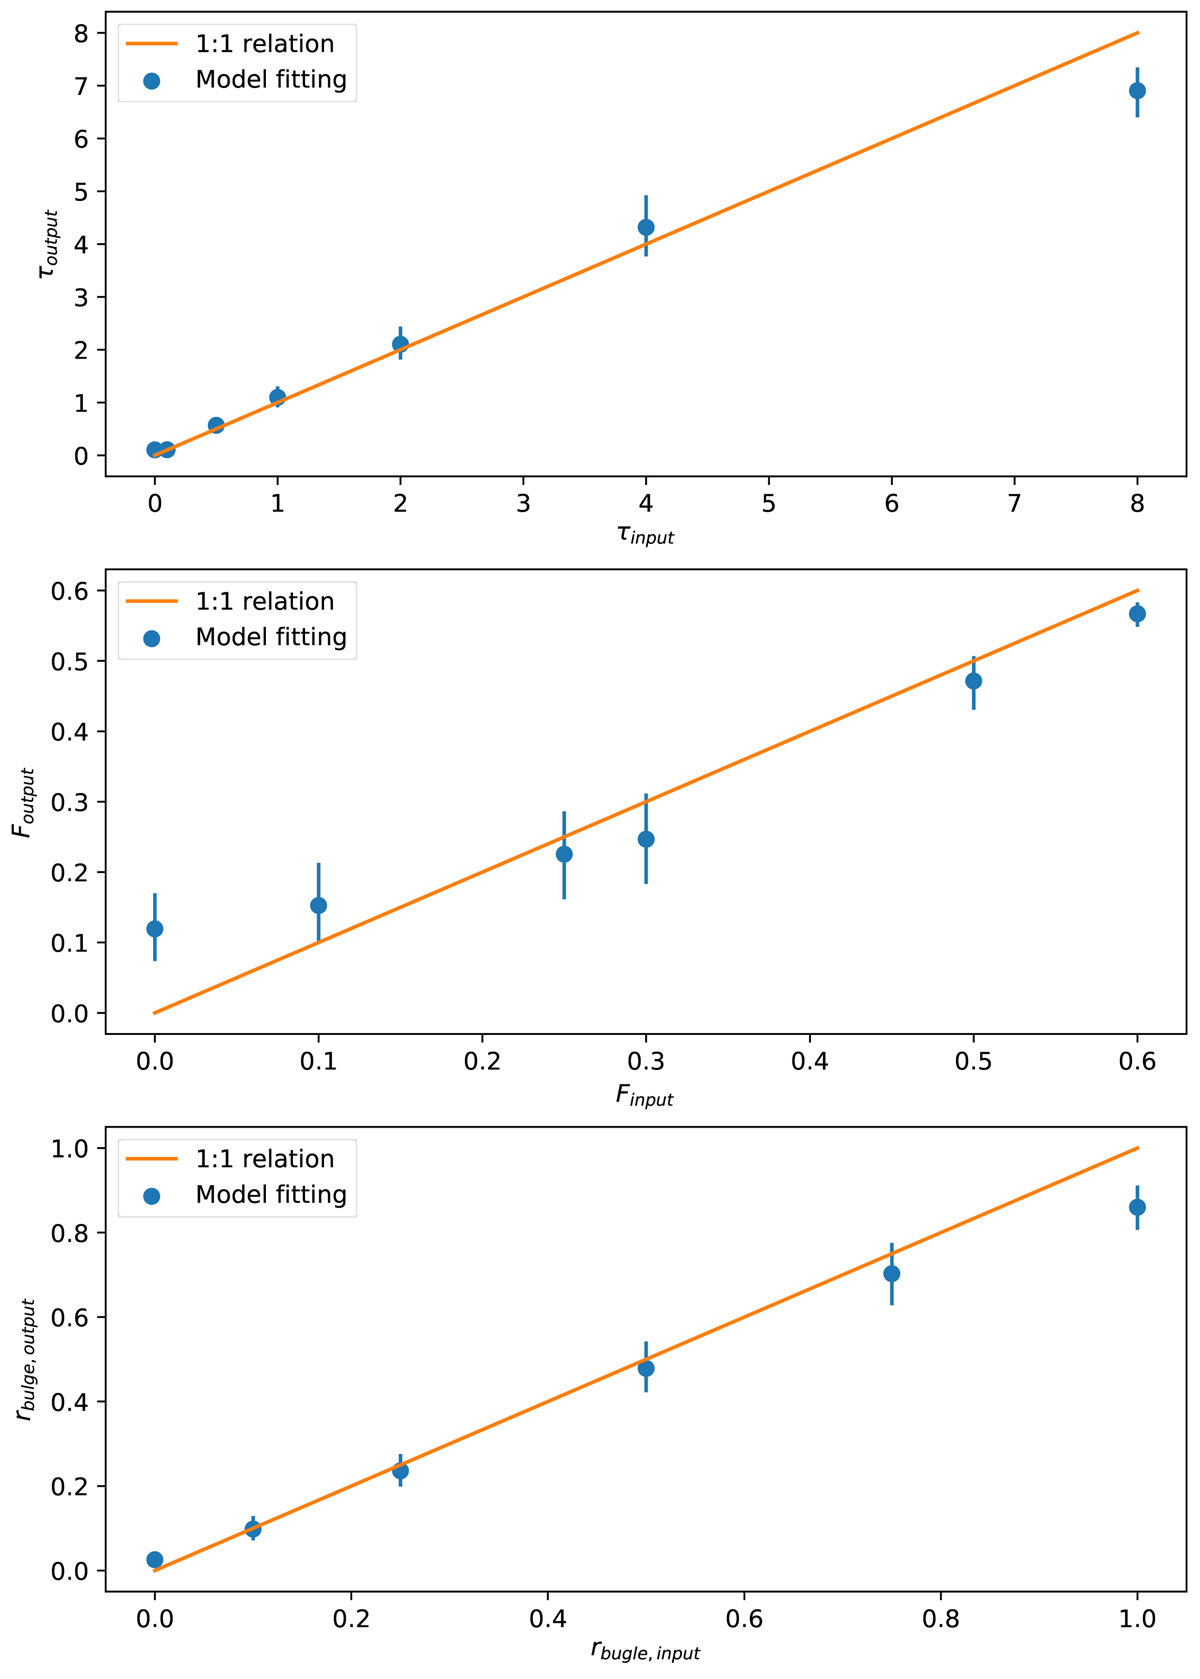
Comparison between the input parameters used to create the T04 model from which simulated NIR to UV attenuation-inclination relations were drawn, and the resulting best-fit parameter. The blue points show the results of the fitting using different values of ![]() , F and rbulge, the orange line is the one−to−one relation. We see that the offset increases the closer the parameters. For each panel, we only vary one of the three parameters. The other two parameters are set to the values given in Sect. D. The figure shows that the fitting result will differ based on how close the model is to the boundaries defined by the prior.
, F and rbulge, the orange line is the one−to−one relation. We see that the offset increases the closer the parameters. For each panel, we only vary one of the three parameters. The other two parameters are set to the values given in Sect. D. The figure shows that the fitting result will differ based on how close the model is to the boundaries defined by the prior.
Current usage metrics show cumulative count of Article Views (full-text article views including HTML views, PDF and ePub downloads, according to the available data) and Abstracts Views on Vision4Press platform.
Data correspond to usage on the plateform after 2015. The current usage metrics is available 48-96 hours after online publication and is updated daily on week days.
Initial download of the metrics may take a while.