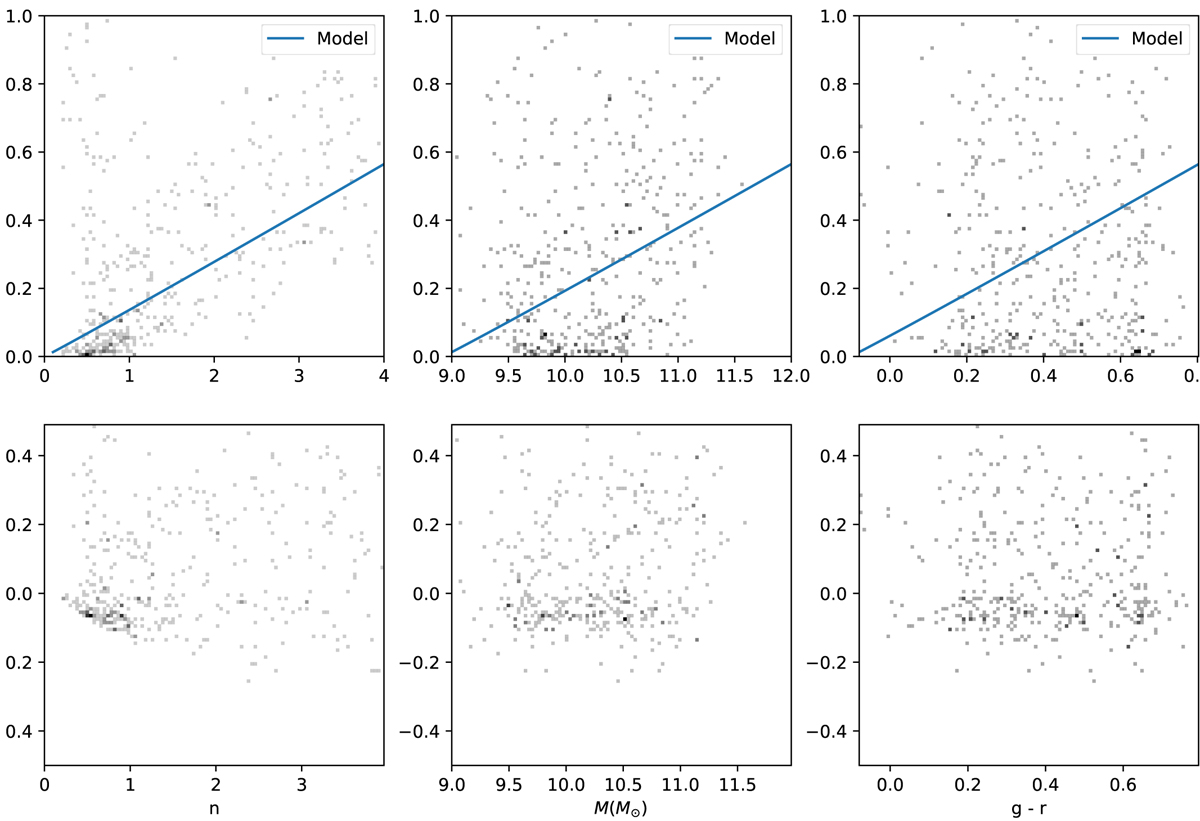
Fig. B.2.
Download original image
Bulge-to-total ratio B/T of galaxies appearing in COSMOS and CANDELS against the Sérsic index n, M* and B − V color. The blue line shows the best-fit model where we change the variable per panel: top-left is for varying n, top-middle is for varying M* and top right is for varying B − V. The bottom panels illustrate the residuals of the data – model for each galaxy. The model seems to mostly agree but tends to underestimate B/T for higher values of the galaxy properties.
Current usage metrics show cumulative count of Article Views (full-text article views including HTML views, PDF and ePub downloads, according to the available data) and Abstracts Views on Vision4Press platform.
Data correspond to usage on the plateform after 2015. The current usage metrics is available 48-96 hours after online publication and is updated daily on week days.
Initial download of the metrics may take a while.