Free Access
Fig. 2.
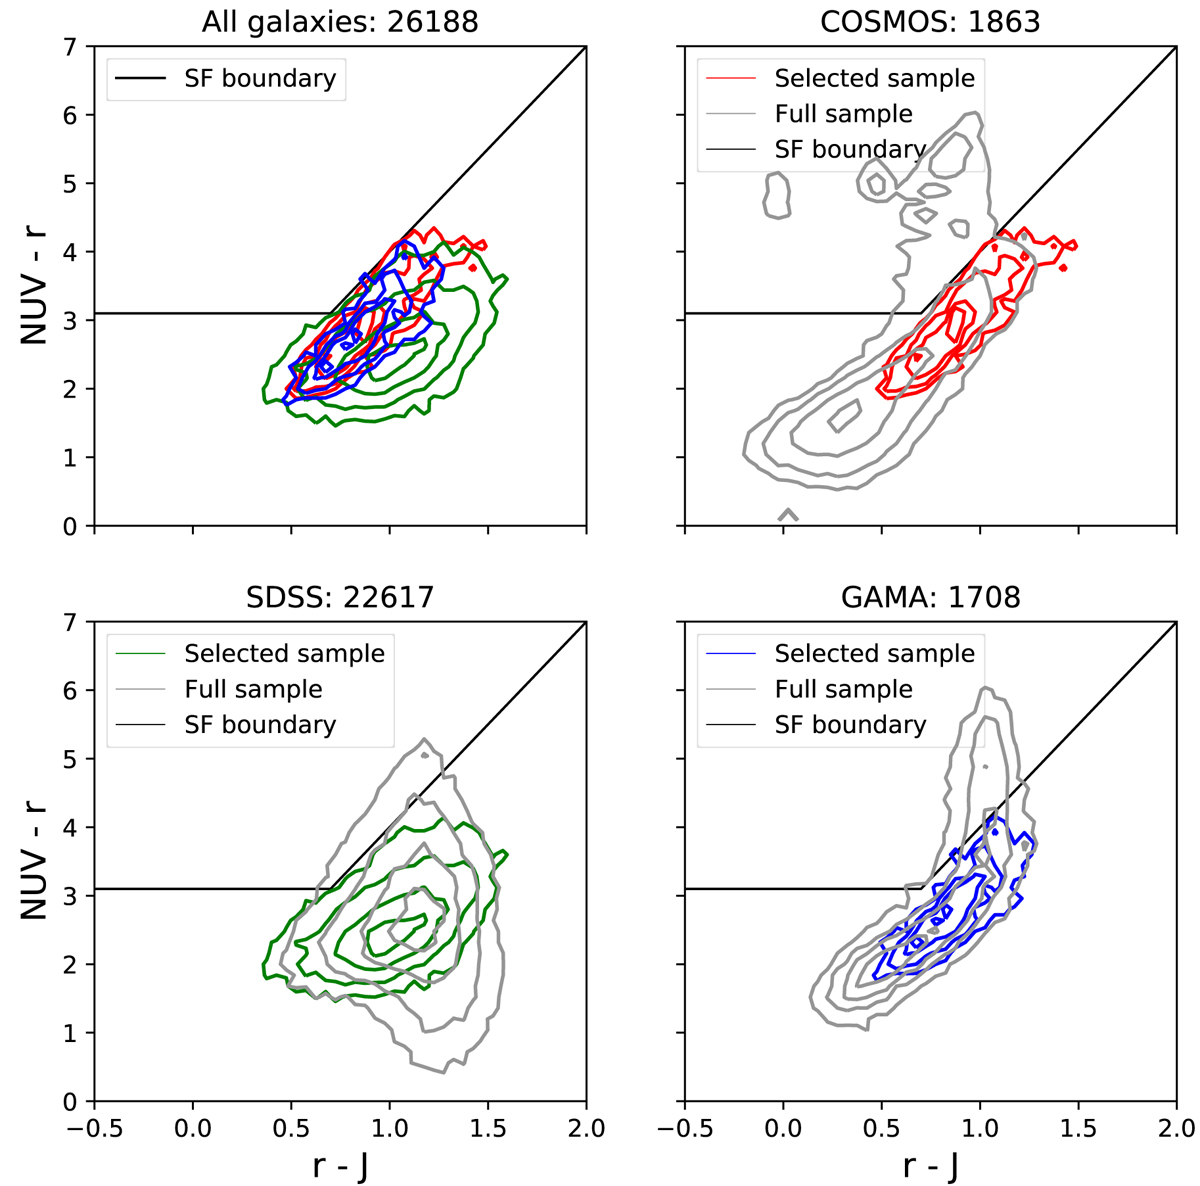
Download original image
Rest-frame NUV − r and r − J color diagram of galaxies used before (gray) and after (colored) applying the selection in star-formation classification and physical properties log(M*) and n, including AGN removal. We select star-forming galaxies to lie below the black line.
Current usage metrics show cumulative count of Article Views (full-text article views including HTML views, PDF and ePub downloads, according to the available data) and Abstracts Views on Vision4Press platform.
Data correspond to usage on the plateform after 2015. The current usage metrics is available 48-96 hours after online publication and is updated daily on week days.
Initial download of the metrics may take a while.