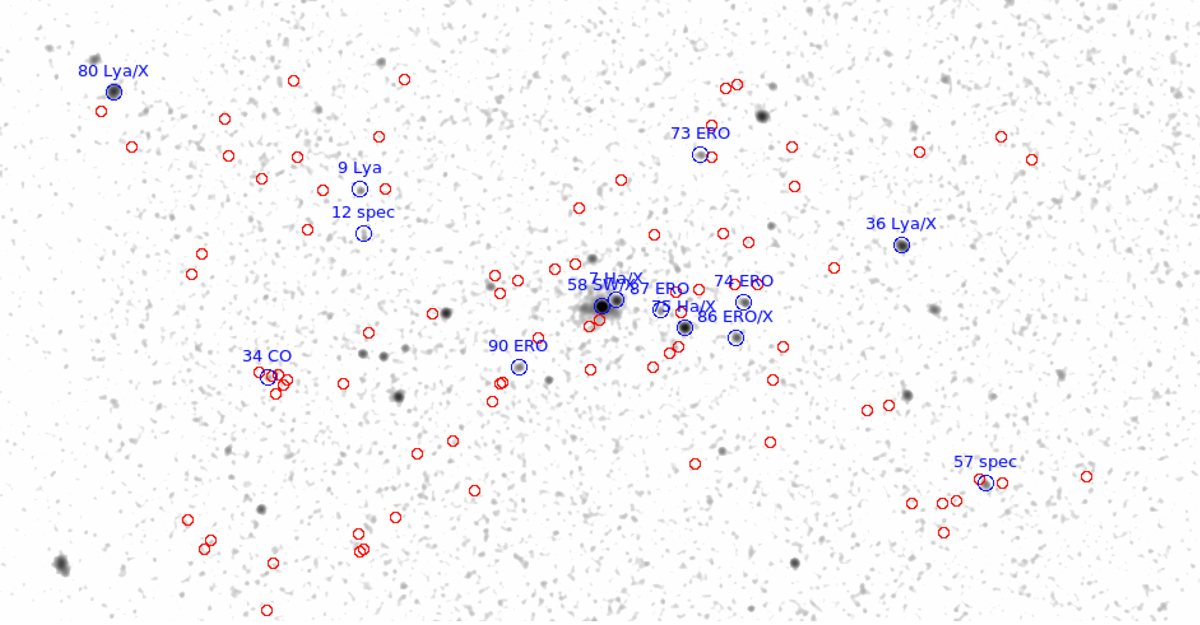
Fig. 8.
Download original image
Hard (0.5–7.0 keV) band image of the center of the field (a box of 460 × 240 arcsec) with the X-ray-emitting protocluster members marked with blue circles, and all the other spectroscopically confirmed protocluster members (2.0 < z < 2.3) marked with red circles. The image has been smoothed with a 1 arcsec Gaussian filter for clarity. X-ray members are labeled with the source ID, the original selection: Ha, Lya, ERO, and CO for Hα, Lyα, red color, and CO-line selection, respectively, and “spec” for spectroscopic selection. Finally, the sources labeled with “X” were previously identified as X-ray sources in the literature, as described in Sect. 2.2.
Current usage metrics show cumulative count of Article Views (full-text article views including HTML views, PDF and ePub downloads, according to the available data) and Abstracts Views on Vision4Press platform.
Data correspond to usage on the plateform after 2015. The current usage metrics is available 48-96 hours after online publication and is updated daily on week days.
Initial download of the metrics may take a while.