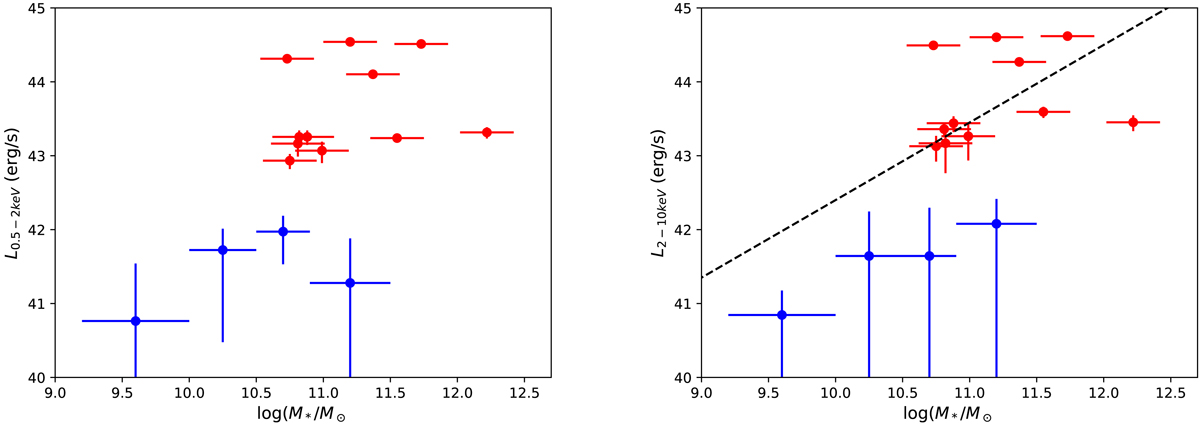
Fig. D.1.
Download original image
X-ray luminosity and stellar mass relations. Left panel: Red points show the distribution of 12 protocluster members (including the Spiderweb Galaxy but excluding the two Compton-thick candidates) in the soft-band, intrinsic luminosity and stellar mass plane. Blue points are obtained stacking the protocluster members without X-ray detection in bins of stellar mass. We note that stacked LX values should be considered upper limits, because, despite the formal positive detection, all the stacked values are consistent with noise within 1 or 1.5 σ. Right panel: Same as the left panel but in the rest-frame hard band.
Current usage metrics show cumulative count of Article Views (full-text article views including HTML views, PDF and ePub downloads, according to the available data) and Abstracts Views on Vision4Press platform.
Data correspond to usage on the plateform after 2015. The current usage metrics is available 48-96 hours after online publication and is updated daily on week days.
Initial download of the metrics may take a while.