Fig. 15.
Download original image
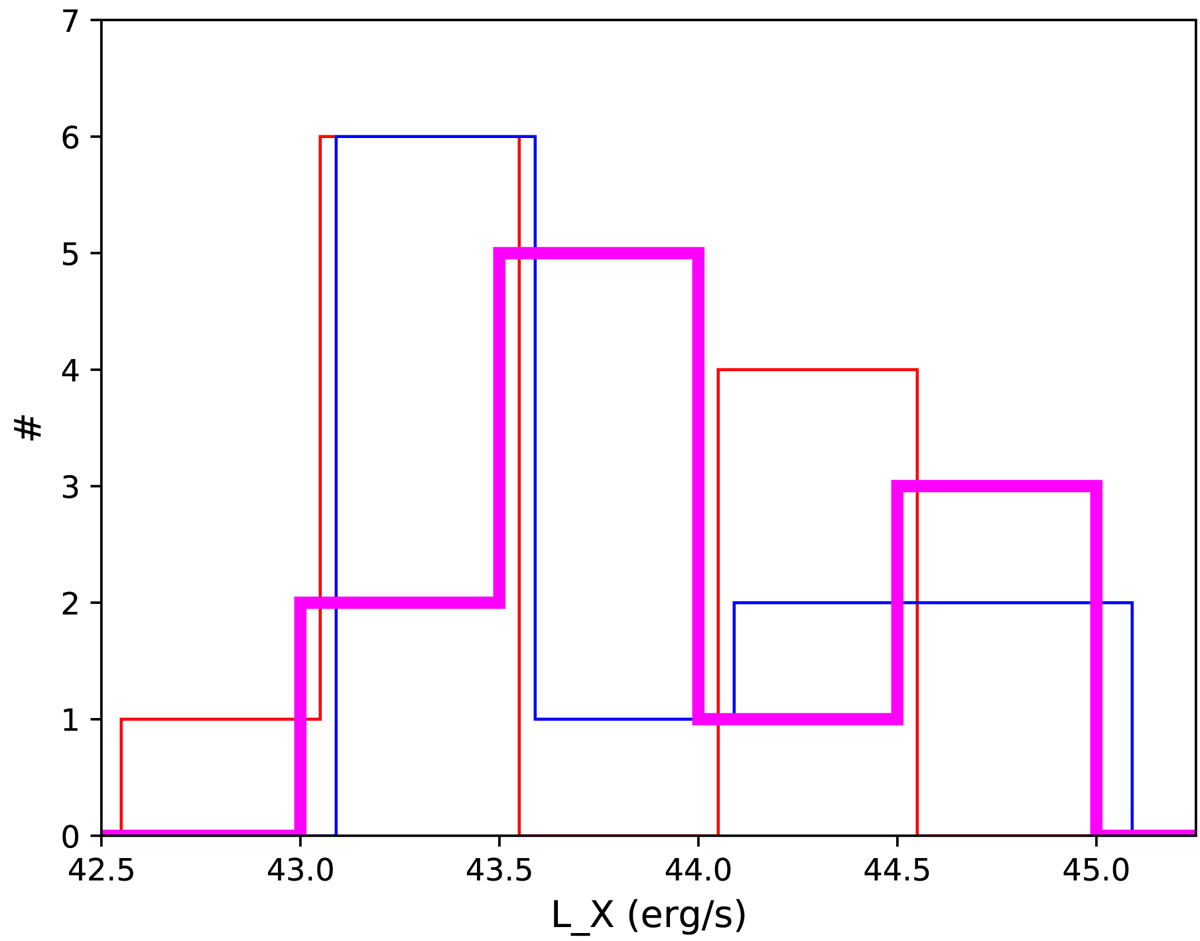
Distribution of the X-ray luminosity of the 11 protocluster members (excluding the Spiderweb and the two Compton-thick candidates) in the soft (thin red line), hard (thin blue line), and total band (thick magenta line). For clarity, the histograms for the soft and hard luminosities are shifted by 0.05 and 0.1 dex, respectively.
Current usage metrics show cumulative count of Article Views (full-text article views including HTML views, PDF and ePub downloads, according to the available data) and Abstracts Views on Vision4Press platform.
Data correspond to usage on the plateform after 2015. The current usage metrics is available 48-96 hours after online publication and is updated daily on week days.
Initial download of the metrics may take a while.