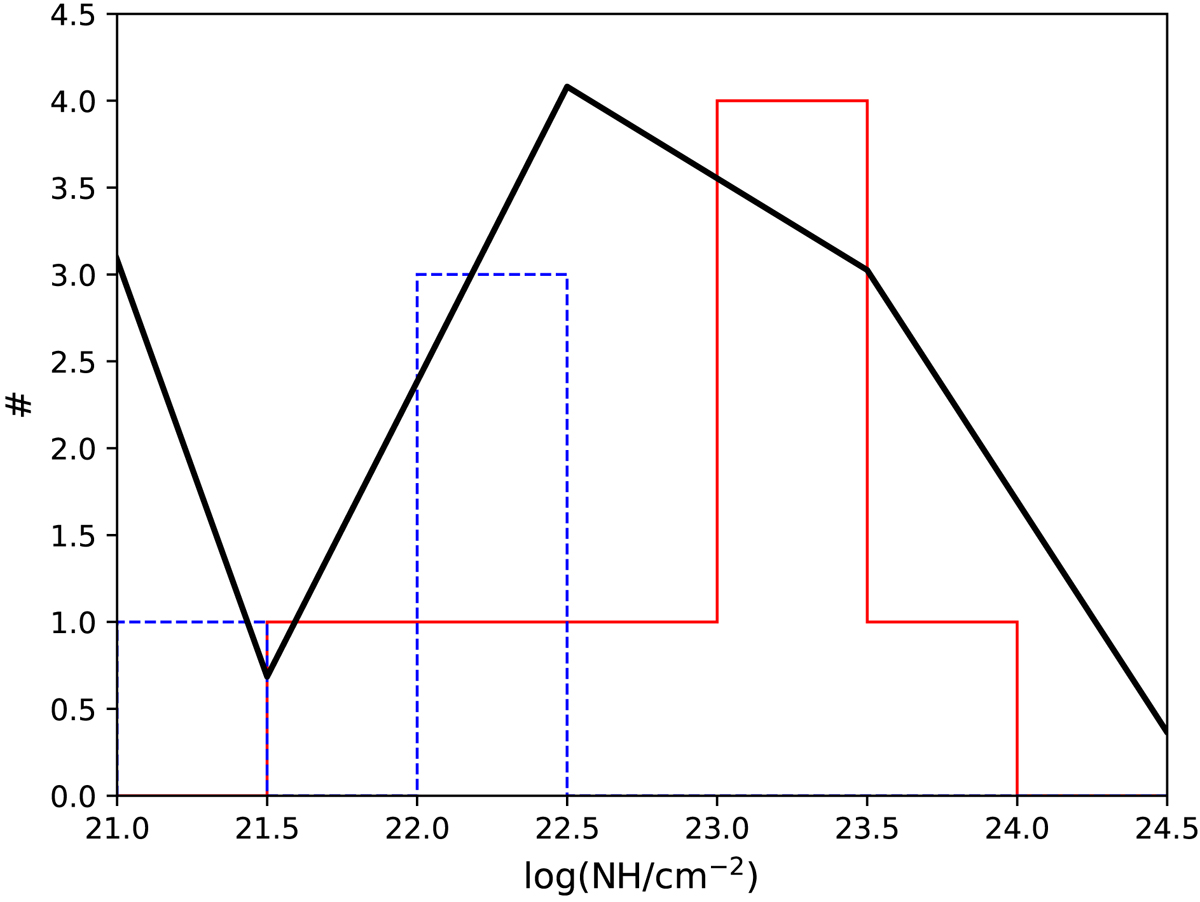
Fig. 14.
Download original image
Intrinsic absorption in AGN protocluster members. The red histogram shows the distribution of the intrinsic absorption of the eight protocluster members (including the Spiderweb) for which a robust measurement of NH has been possible. The blue dashed histogram shows the upper limits on NH obtained for six sources. The black solid line shows the distribution of NH expected in the model of Gilli et al. (2007) at the flux limit of our observations. The two Compton-thick candidates with a reflection-dominated spectrum are not included.
Current usage metrics show cumulative count of Article Views (full-text article views including HTML views, PDF and ePub downloads, according to the available data) and Abstracts Views on Vision4Press platform.
Data correspond to usage on the plateform after 2015. The current usage metrics is available 48-96 hours after online publication and is updated daily on week days.
Initial download of the metrics may take a while.